用过Matlab的小伙伴应该都知道Matlab的plot(当然包括scatter3,plot3之类的)的一些基本操作,但是该如何使用Matlab来做一些视图中的一些简单的鼠标事件的操作呢?
(注:本专栏都为本人在开发过程中遇到的一些有意思的操作和问题,这里仅为分享,详细的教程还要到Matlab中文论坛等官网上进行学习,本篇不是教程)
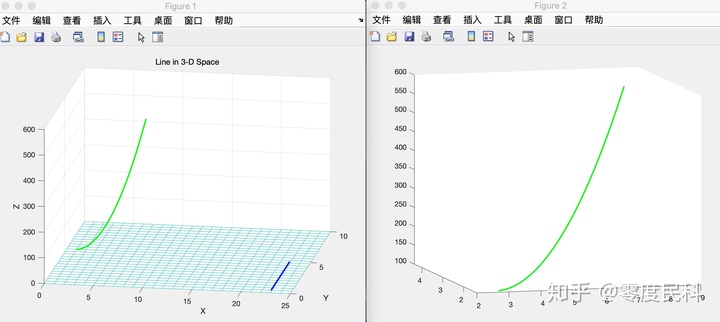
1.给plot3的坐标面上加上网格线,使三维曲线更加直观
直接上代码
t=0:0.01:2.2;
z=104*(1+t.^2)-26*t;
x=3*(1+t)*cosd(27);
y=3*(1+t)*sind(27);

x1=0:25;
[X]=meshgrid(x1);%构造1×1网格,20×20个
Y=0:0.4:10;
Z=0*X;
mesh(X,Y,Z)
hold on;
plot3(x,y,z,'g','LineWidth',2);

t0=0:0.01:4.65;
x0=0*t0+22.899;
y0=0.326+t0;
z0=0*t0+1.5;
%ff;
plot3(x0,y0,z0,'b','LineWidth',2);

title('Line in 3-D Space');
xlabel('X');ylabel('Y');zlabel('Z');
没错,就是直接用meshgrid生成网格
效果对比:
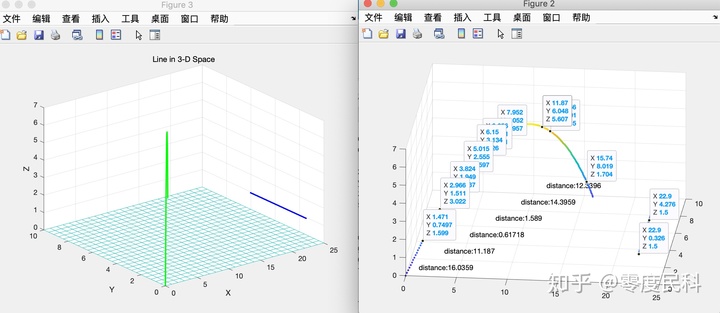
2.在scatter中使用鼠标取点并输出相关量
function [distance,pos] = getpointsXYZ(x,y,z,n)
hFigure= figure;
scatter3(x,y,z,10,z,'filled')
datacursormode on
dcm_obj = datacursormode(hFigure); %这个就是获取坐标的函数,具体可以去Matlab官方文档中查找相关用法
pos = zeros(n,3);
%x=zeros(1,1);
distance=zeros(100,1);
for j=1:100
for i = 1:2
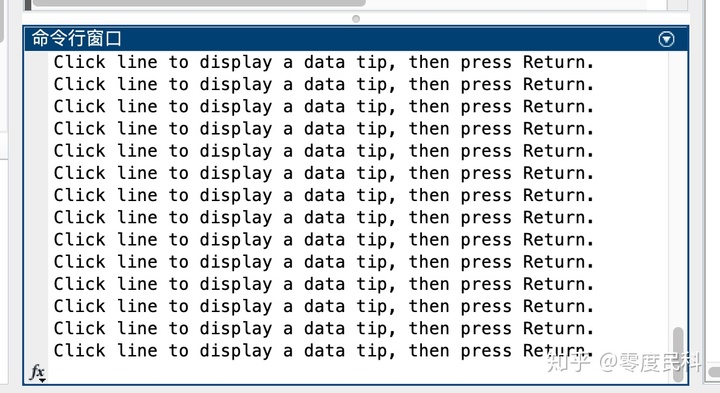
disp('Click line to display a data tip, then press Return.') %在命令行中实现交互
% Wait while the user does this.
pause
c_info = getCursorInfo(dcm_obj); %获取鼠标相应
pos(i,:) = c_info.Position;
%x=sqrt((pos(1,1)-pos(2,1))^2+(pos(1,2)-pos(2,2))^2+(pos(1,3)-pos(2,3))^2);
distance(j,1)=sqrt((pos(1,1)-pos(2,1))^2+(pos(1,2)-pos(2,2))^2+(pos(1,3)-pos(2,3))^2); %这里试一下计算两点的距离
end
str=[repmat('distance:',1,1) num2str(distance(j,1))]; %可以在scatter图中输出想要的量,便于可视化操作
text(-1+2*j,-1+2*j,cellstr(str))
end这里通过搜索和自己的修改,写了一个可以用鼠标在scatter3图中取点并返回相应的坐标的函数,有了可以取点的函数再实现GUI界面的操作就可以了
t=0:0.01:2.2;
z=104.7*(1-exp(-11*t/30))-26*t;
x=33*(1-exp(-11*t/30))*cosd(27);
y=33*(1-exp(-11*t/30))*sind(27);

x1=0:25;
[X]=meshgrid(x1);
Y=0:0.4:10;
Z=0*X;
mesh(X,Y,Z)
hold on;
plot3(x,y,z,'g','LineWidth',2);

t0=0:0.01:4.65;
x0=0*t0+22.899;
y0=0.326+t0;
z0=0*t0+1.5;
%ff;
plot3(x0,y0,z0,'b','LineWidth',2);

title('Line in 3-D Space');
xlabel('X');ylabel('Y');zlabel('Z');

xx=[x,x0];
yy=[y,y0];
zz=[z,z0];
[distance,pos]=getpointsXYZ(xx,yy,zz,2);


function [distance,pos] = getpointsXYZ(x,y,z,n)

hFigure= figure;
scatter3(x,y,z,10,z,'filled')

datacursormode on

dcm_obj = datacursormode(hFigure);

pos = zeros(n,3);
%x=zeros(1,1);
distance=zeros(100,1);
for j=1:100
    for i = 1:2
        disp('Click line to display a data tip, then press Return.')
        % Wait while the user does this.
        pause

        c_info = getCursorInfo(dcm_obj);
        pos(i,:) = c_info.Position;
        distance(j,1)=sqrt((pos(1,1)-pos(2,1))^2+(pos(1,2)-pos(2,2))^2+(pos(1,3)-pos(2,3))^2);

    end
    str=[repmat('distance:',1,1) num2str(distance(j,1))];
    text(-1+2*j,-1+2*j,cellstr(str))
end

end
这里的分享仅为我做开发时遇到的一些有意思的操作,实际上要获得仿真效果还是推荐自己迭代或者直接用Simulink做仿真。这里仅仅因为可视化效果不错而且对初学者比较好理解所以向大家推荐(因为本人就是一个小白)
参考
1.^利用Matlab鼠标单击拾取三维点云可视化图像figure中的单个或多个点坐标信息_人工智能_qq_26447137的博客-CSDN博客
版权声明:本文为weixin_35933239原创文章,遵循CC 4.0 BY-SA版权协议,转载请附上原文出处链接和本声明。