Matplotlib 简介
Matplotlib是一个Python 2D绘图库,它以多种硬拷贝格式和跨平台的交互式环境生成出版物质量的图形。 Matplotlib可用于Python脚本,Python和IPython (opens new window)Shell、Jupyter (opens new window)笔记本,Web应用程序服务器和四个图形用户界面工具包。
Matplotlib的安装
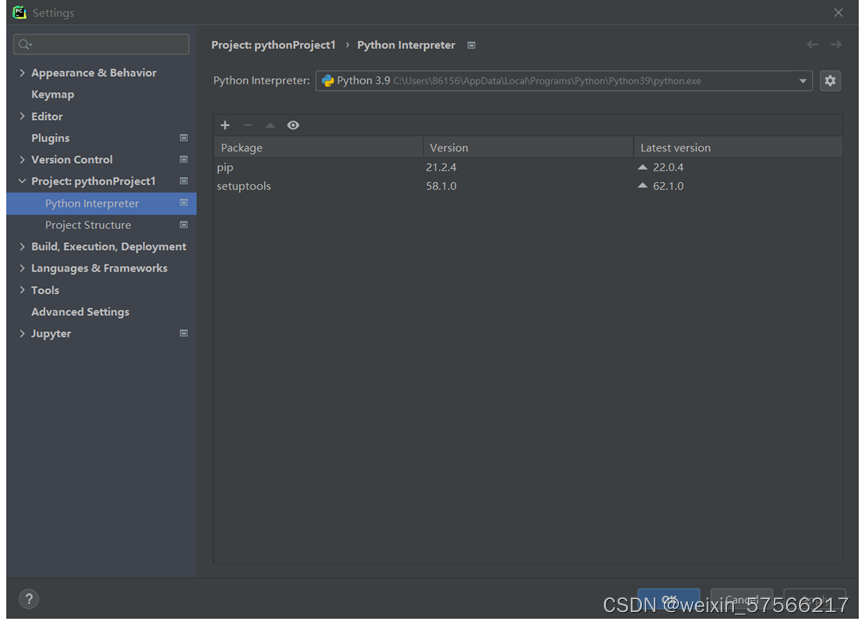
- 点击左上角的File 找到Settings

- 在左侧选项栏里选择python interpreter 在出现的右框里选择➕
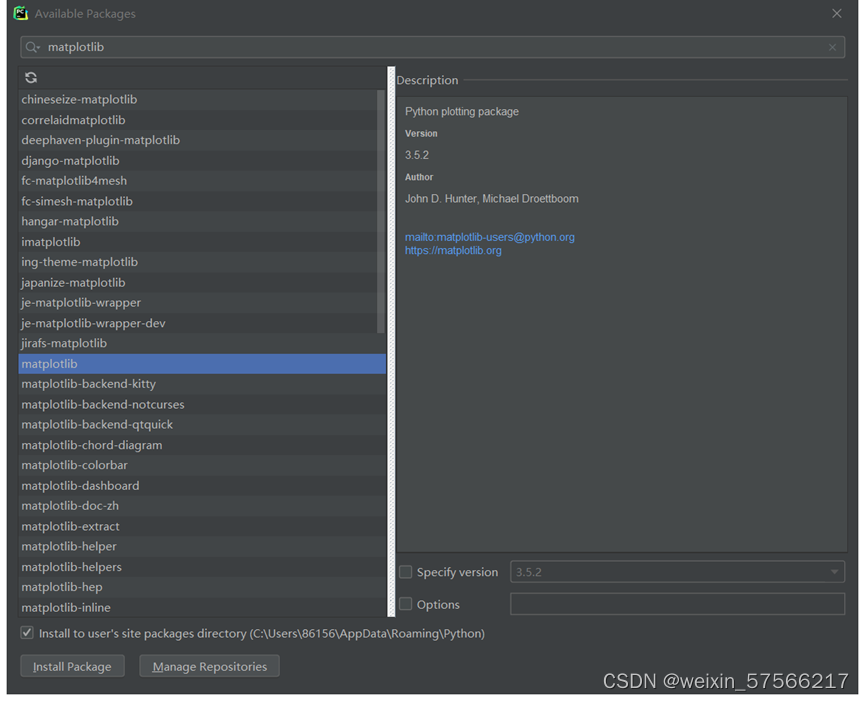
- 在搜索框里直接搜索matplotlib,然后选择不带后缀的那个,点击install packge,显示添加成功即可
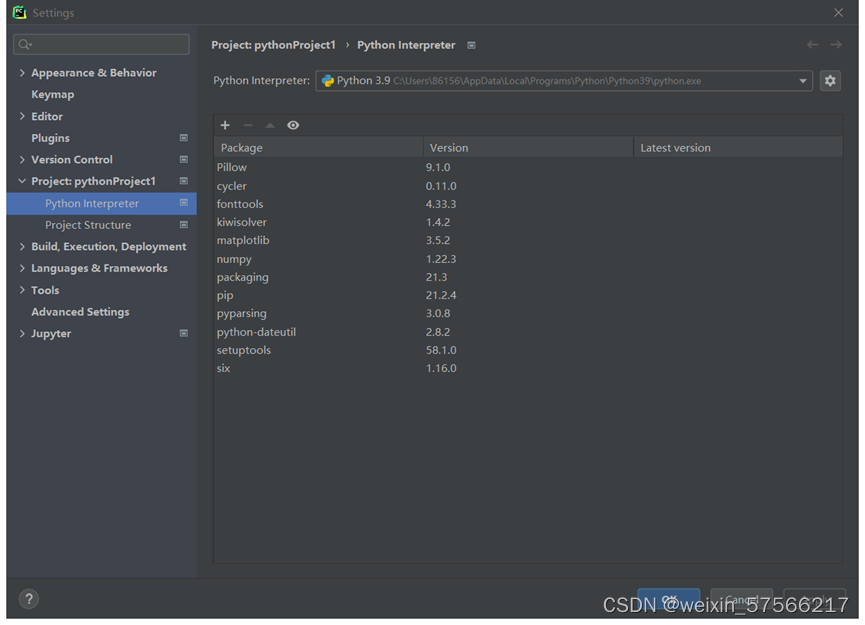
- 安装完成
Matplotlib的使用
Matplotlib
散点图: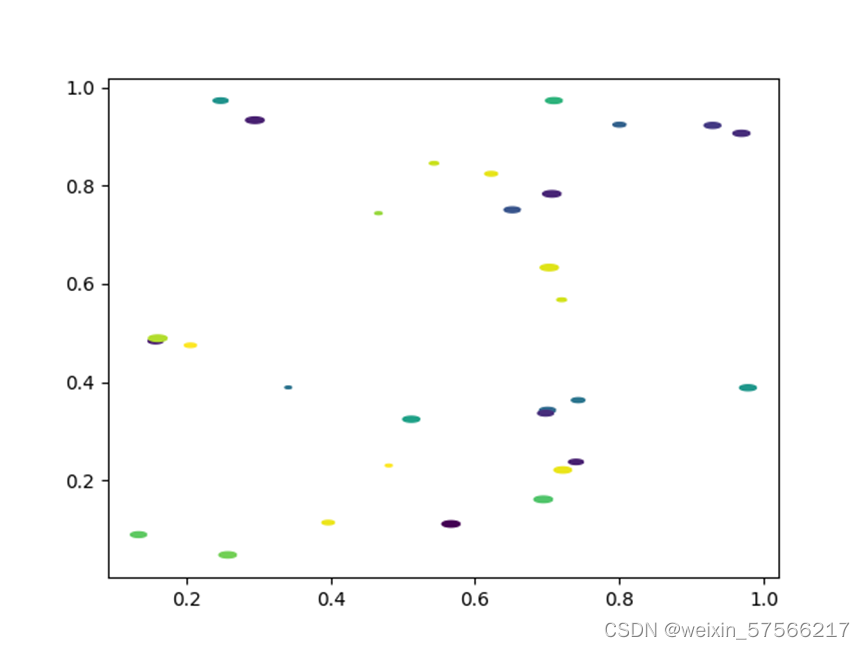
代码:import matplotlib.pyplot as plt
import numpy as np
# Fixing random state for reproducibility
np.random.seed(19680801)
# unit area ellipse
rx, ry = 3., 1.
area = rx * ry * np.pi
theta = np.arange(0, 2 * np.pi + 0.01, 0.1)
verts = np.column_stack([rx / area * np.cos(theta), ry / area * np.sin(theta)])
x, y, s, c = np.random.rand(4, 30)
s *= 10**2.
fig, ax = plt.subplots()
ax.scatter(x, y, s, c, marker=verts)
plt.show()在python里面想要进行可视化操作提前需要导入matplotlib.pyplot这个库:
import matplotlib.pyplot as pltx,y对应了平面点的位置,s控制点大小,c对应颜色指示值,也就是如果采用了渐变色的话,我们设置c=x就能使得点的颜色根据点的x值变化marker控制点的形状
ax.scatter(x, y, s, c, marker=verts)折线图: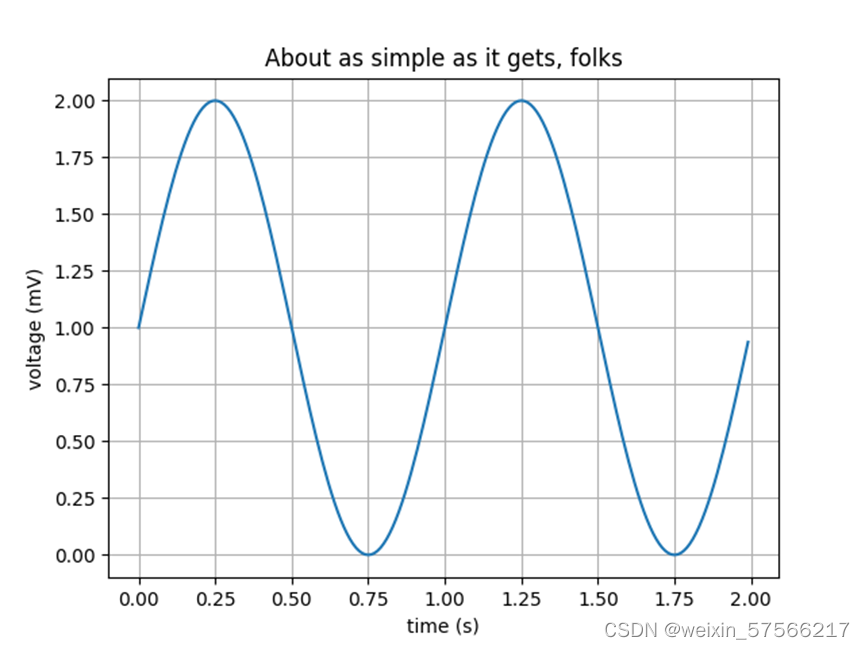
代码:
import matplotlib.pyplot as plt
import numpy as np

# Data for plotting
t = np.arange(0.0, 2.0, 0.01)
s = 1 + np.sin(2 * np.pi * t)
fig, ax = plt.subplots()
ax.plot(t, s)
ax.set(xlabel='time (s)', ylabel='voltage (mV)',
       title='About as simple as it gets, folks')
ax.grid()
fig.savefig("test.png")
plt.show()
绘制画布
fig, ax = plt.subplots()显示网格
ax.grid()设置X,Y轴的标题
ax.set(xlabel='time (s)', ylabel='voltage (mV)',
       title='About as simple as it gets, folks')
将图片文件保存在.py文件的相同目录下
fig.savefig("test.png")柱状图: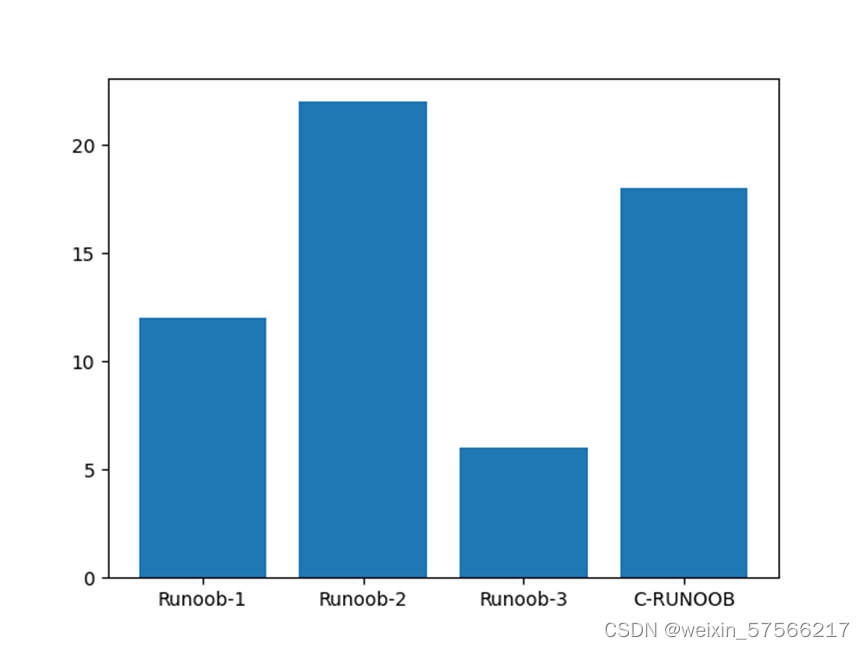
代码:import matplotlib.pyplot as plt
import numpy as np
x = np.array(["Runoob-1", "Runoob-2", "Runoob-3", "C-RUNOOB"])
y = np.array([12, 22, 6, 18])
plt.bar(x,y)
plt.show()版权声明:本文为weixin_57566217原创文章,遵循CC 4.0 BY-SA版权协议,转载请附上原文出处链接和本声明。