此方法是直接引入echarts文件,不用使用npm安装,且全局可用,其他引入方法有时候没用,
不知道echarts怎么使用的可以去看看我之前的教程,适合新手小白:
https://blog.csdn.net/qq_23073811/article/details/123425963
1.下载echarts文件
从ehcarts官方下载地址下载echarts.min.js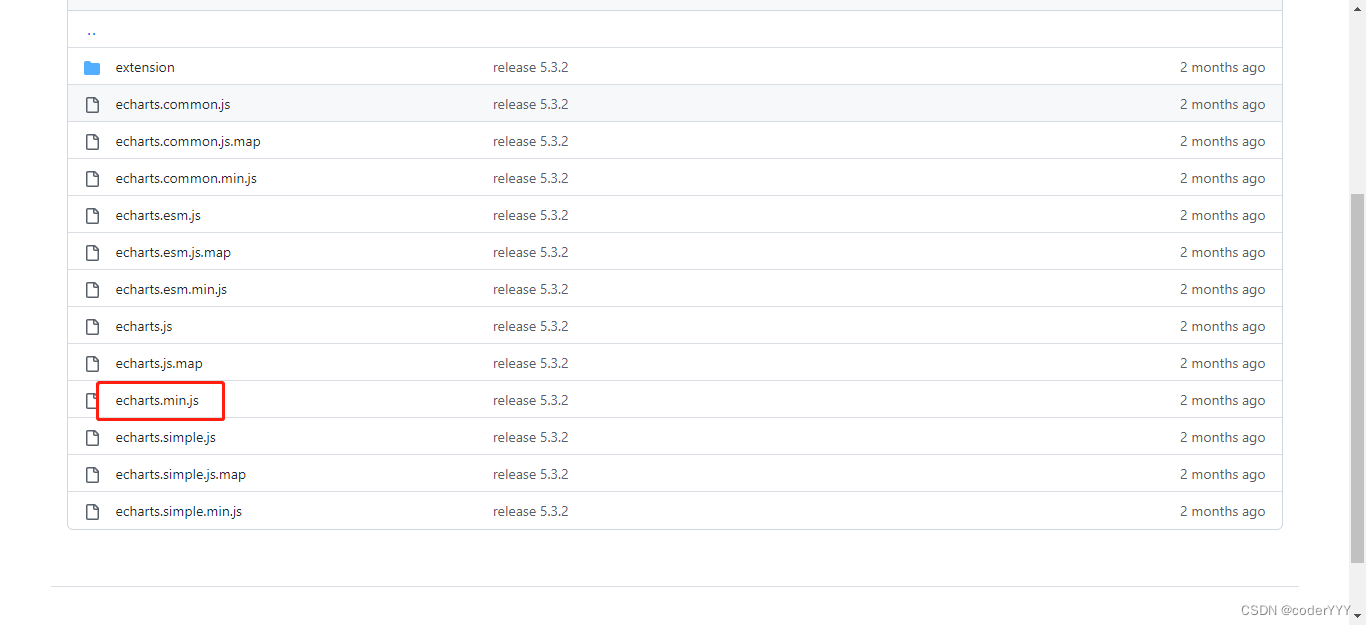
我这里是把它放在了项目的public\static\lib下面,放其他地方也可以,但是项目规范一般是把它放这里。
2.全局引入
在public\index.html引入echarts.min.js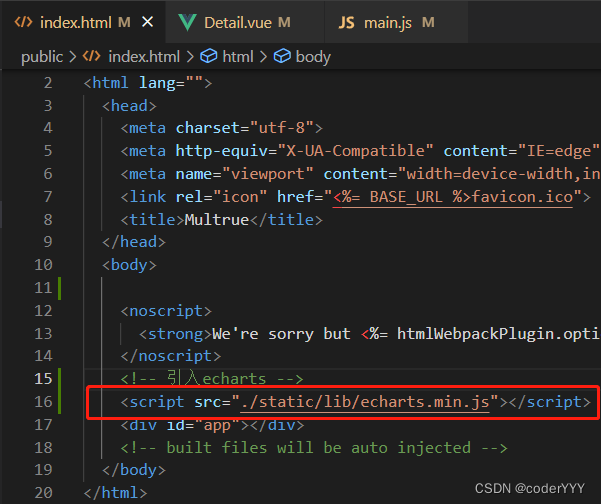
在项目根目录的main.js中挂载到全局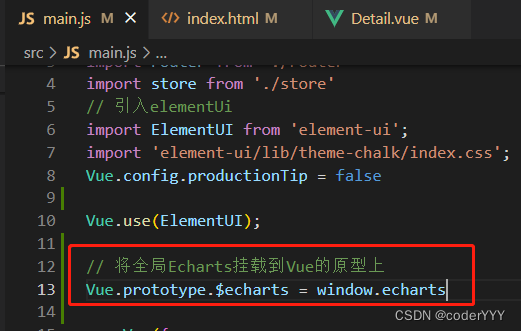
// 将全局Echarts挂载到Vue的原型上
Vue.prototype.$echarts = window.echarts
3.在Vue中使用
先写一个元素,注意!!这个元素必须有宽高,不然echarts是显示不出来的!!!!
这里用Vue的ref,比较方便获取元素
<div class="priceChart" ref="price_ref"></div>
.priceChart{
	width: 100%;
	height: 300px;
}
我们先在methods里面定义一个方法,这里的例子用的是echarts的折线图,比较简单
methods:{
initPriceOptions() {
      this.chartInstance = this.$echarts.init(this.$refs.price_ref);
	  console.log(this.chartInstance)
      const initOption = {
        xAxis: {
          type: "category",
          boundaryGap: false,
          data: ["6/1", "6/2", "6/3", "6/4", "6/5", "6/7", "7/8"],

        },
        yAxis: {
          type: "value",
		   axisLine:{

		   }
        },
        series: [
          {
            data: [820, 932, 901, 934, 1290, 1330, 1320],
            type: "line",
            areaStyle: {
				color:'rgba(254,222,9,.2)'
			},
			 itemStyle : {
	                 normal : {
	                     color:'#F9D800',
	                     lineStyle:{
	                         color:'#F9D800'
	                     }
	                 }
	             },
          },
        ],
		tooltip:{
			show:true
		}
      };
	  this.chartInstance.setOption(initOption)
    },
}
在mounted中调用这个方法
  mounted() {
		this.initPriceOptions()
	},
成功显示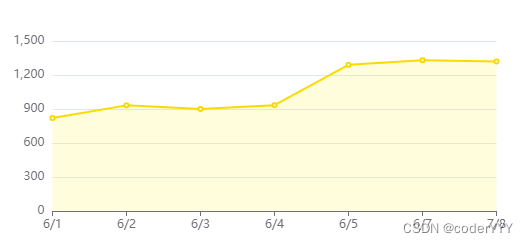
在Vue中使用echarts很简单,大家快去试试看吧~~
版权声明:本文为qq_23073811原创文章,遵循CC 4.0 BY-SA版权协议,转载请附上原文出处链接和本声明。