source
install
alertmanager
wget https://github.com/prometheus/alertmanager/releases/download/v0.24.0/alertmanager-0.24.0.linux-amd64.tar.gz -O alertmanager.tar.gz
tar -zxvf alertmanager.tar.gz
cd alertmanager
#看到alertmanager的运行文件和一个简单的配置demo
./alertmanager -h
#查看命令帮助
alertmanager.yml
route:
  group_by: ["alertname"]
  group_wait: 30s
  group_interval: 5m
  repeat_interval: 1h
  receiver: "web.hook"
receivers:
  - name: "web.hook"
    webhook_configs:
      - url: "http://127.0.0.1:5001/"
inhibit_rules:
  - source_match:
      severity: "critical"
    target_match:
      severity: "warning"
    equal: ["alertname", "dev", "instance"]
./alertmanater在9093端口启动一个alertmanager服务
node exporter
prometheus从各种各样的exporter收集指标
wget https://github.com/prometheus/node_exporter/releases/download/v1.3.1/node_exporter-1.3.1.linux-amd64.tar.gz -O node_exporter.tar.gz
tar -zxvf node_exporter.tar.gz
cd node_exporter
#能看到node_exporter的运行程序
./node_exporter
#在端口9100启动一个节点监控
prometheus
wget https://github.com/prometheus/prometheus/releases/download/v2.36.2/prometheus-2.36.2.linux-amd64.tar.gz -O prometheus.tar.gz
tar -zxvf prometheus
cd prometheus
#看到prometheus的运行文件和一个简单的配置demo
./prometheus -h
#show usage of prometheus
修改你的prometheus.yml文件
prometheus.yml
# my global config
global:
  scrape_interval: 15s # Set the scrape interval to every 15 seconds. Default is every 1 minute.
  evaluation_interval: 15s # Evaluate rules every 15 seconds. The default is every 1 minute.
  # scrape_timeout is set to global default (10s).
# Alertmanager configuration
alerting:
  alertmanagers:

    - static_configs:
        - targets:
            - localhost:9093 # 刚刚搭建的alertmanager的地址
# Load rules once and periodically evaluate them according to the global 'evaluation_interval'.
rule_files:
  - "first_rules.yml" #告警规则文件
  # - "second_rules.yml"
# A scrape configuration containing exactly one endpoint to scrape:
# Here it's Prometheus itself.
scrape_configs:
  # The job name is added as a label `job=<job_name>` to any timeseries scraped from this config.
  - job_name: "prometheus"
    # metrics_path defaults to '/metrics'
    # scheme defaults to 'http'.
    static_configs:
      - targets: ["localhost:9090"]
  - job_name: "node" #刚刚搭建的node_exporter
    static_configs:
      - targets: ["localhost:9100"]
first_rules.yml
groups:
  - name: high_cpu
    rules:
      - alert: HostHighCpuLoad
        #测试用,cpu高于1就告警
        expr: 100 - (avg by(instance) (rate(node_cpu_seconds_total{mode="idle"}[2m])) * 100) > 1
        for: 0m
        labels:
          severity: warning
        annotations:
          summary: Host high CPU load (instance {{ $labels.instance }})
          description: "CPU load is > 80%\n  VALUE = {{ $value }}\n  LABELS = {{ $labels }}"
我使用python flask启动一个简单的http server来接收webhook请求
from flask import Flask, request
app = Flask(__name__)
@app.route("/", methods=["POST"])
def index():
    """docstring for index"""
    print(request.data, "data")
    print(request.args, "args")
    print(request.form, "form")
    return "ok"
grafana
sudo apt-get install -y adduser libfontconfig1
wget https://dl.grafana.com/oss/release/grafana_9.0.0_amd64.deb
sudo dpkg -i grafana_9.0.0_amd64.deb
sudo systemctl enable --now grafana-server.service
用浏览器打开 grafana dashboard
用默认的账号密码登陆 admin/admin
打开datasource设置,添加Prometheus,地址填http://localhost:9090
在grafana面板市场找一个合适的面板,搜索node可以找到节点监控的面板 grafana dashboard market
使用grafana导入面板1860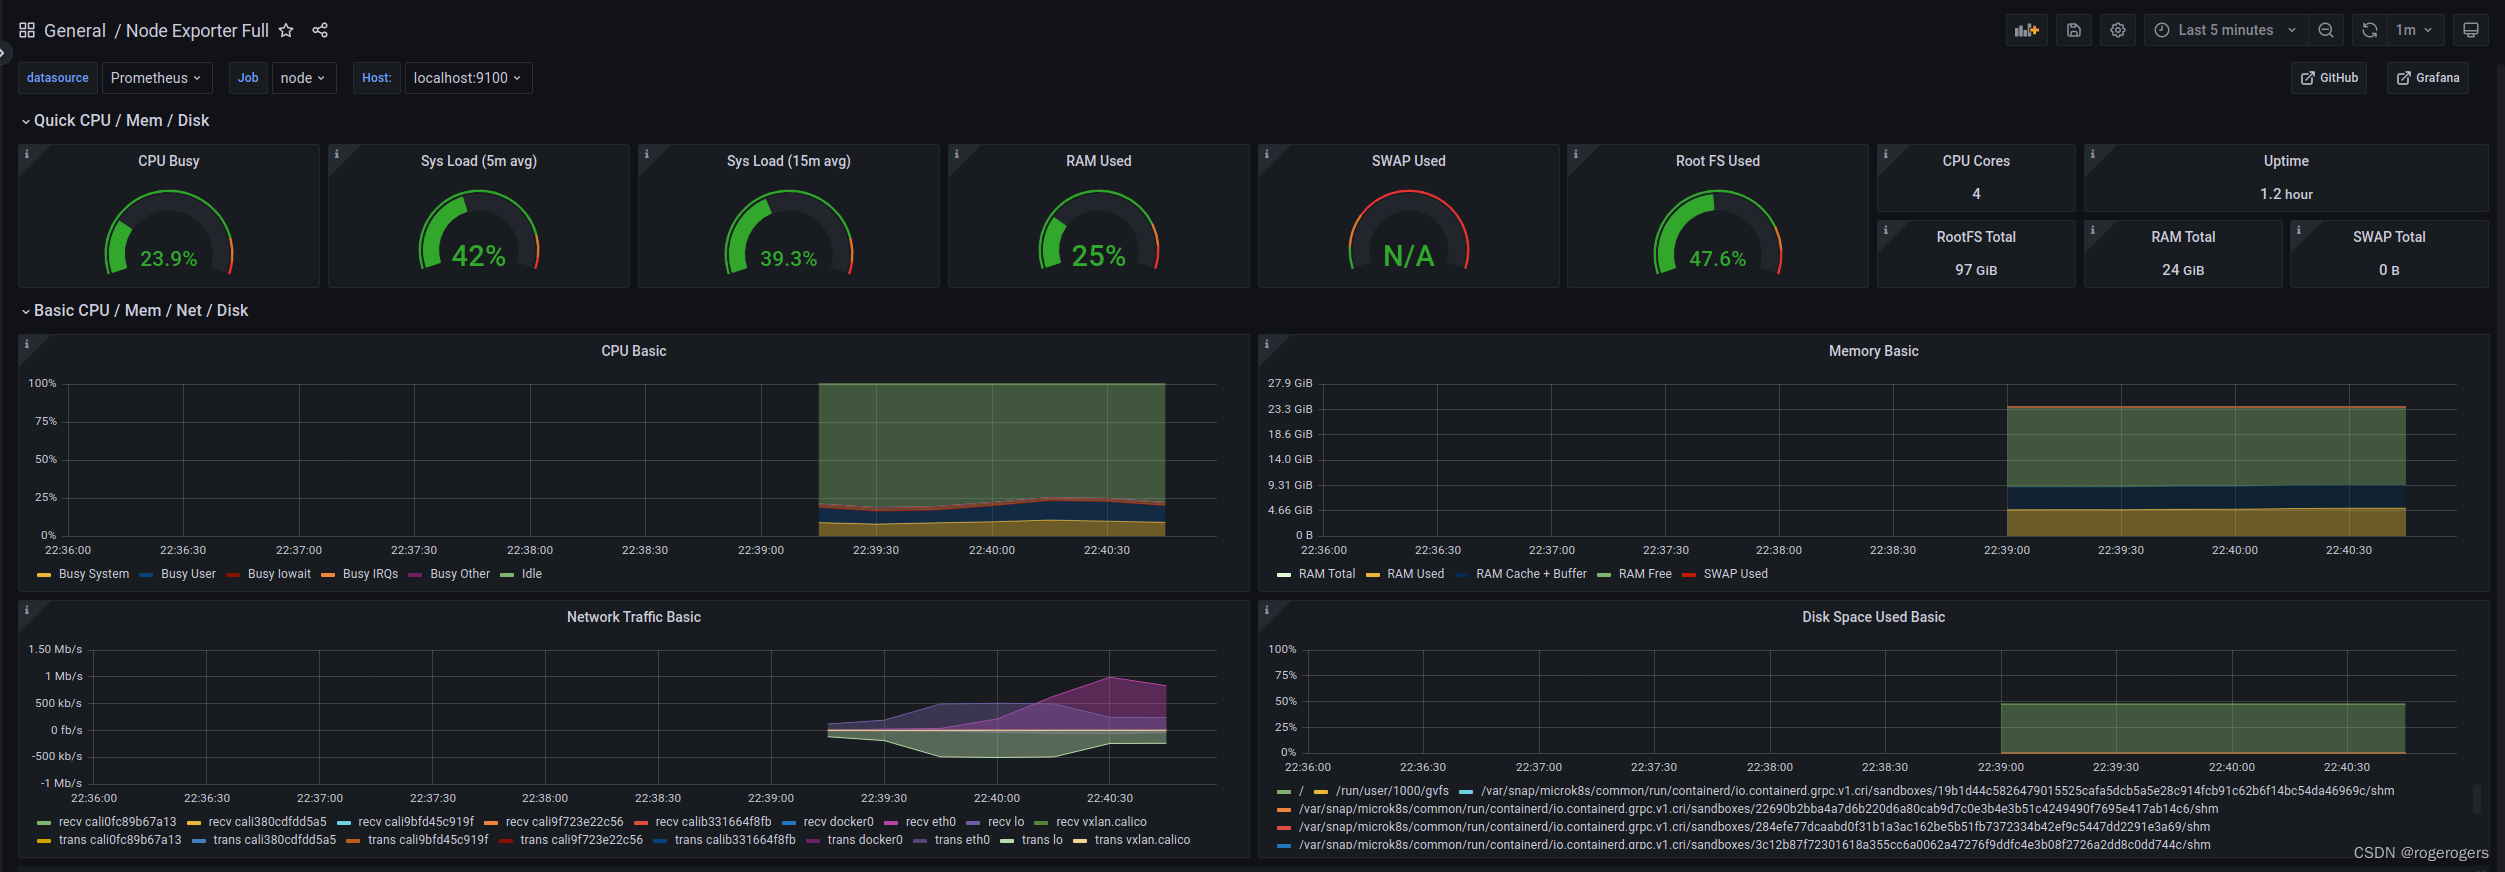
版权声明:本文为dayewan原创文章,遵循CC 4.0 BY-SA版权协议,转载请附上原文出处链接和本声明。