gnuplot入门教程
进入cmd命令窗口,使用 gnuplot命令进入gnuplot,使用 quit命令退出gnuplot。
注意:后文中用到的set命令一旦使用,该命令的作用就一直存在,若不想继续使用该命令的作用,只能使用unset命令取消或重新进入gnuplot。
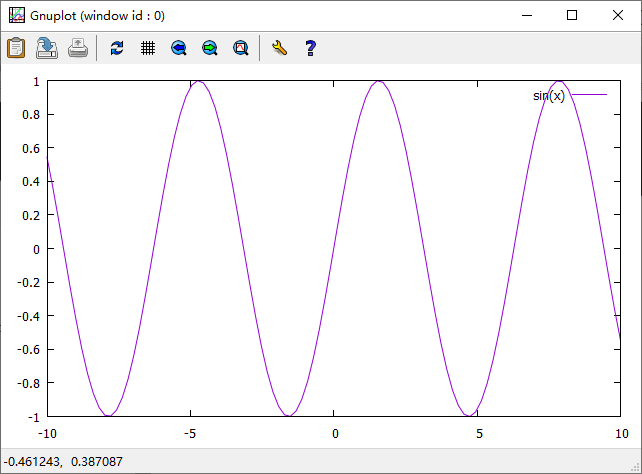
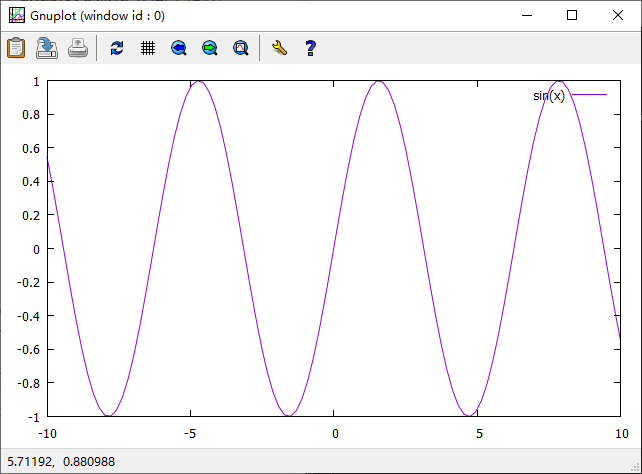
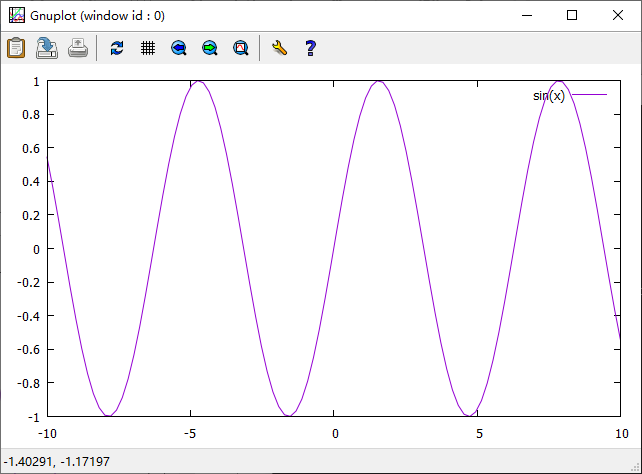
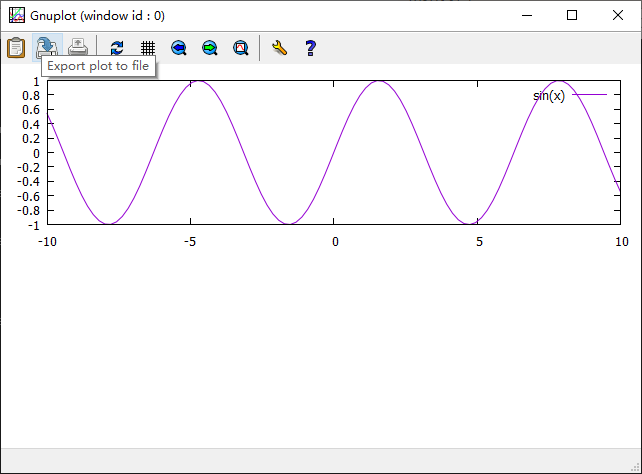
绘制sin(x)
plot sin(x)
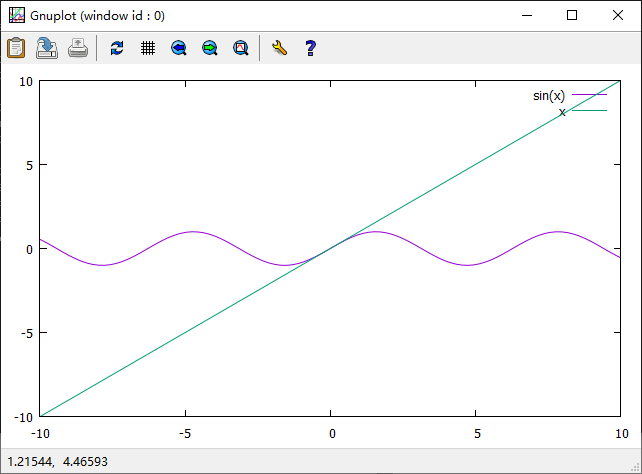
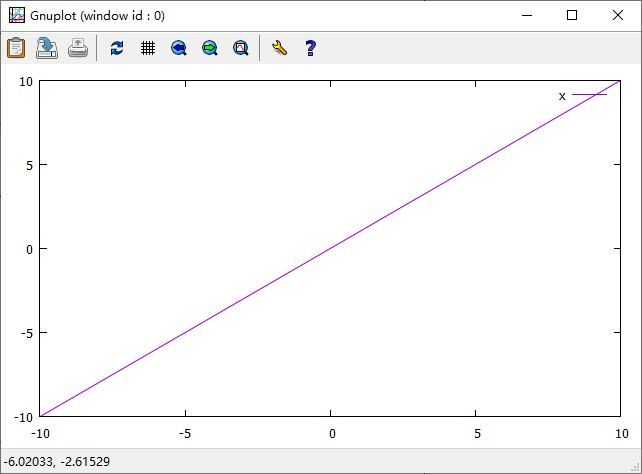
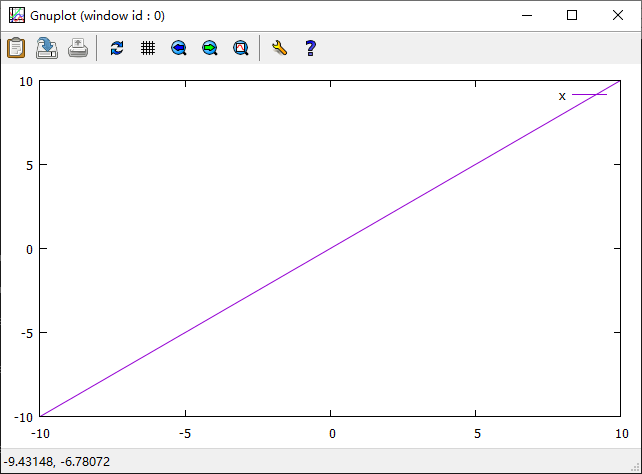
同时绘制sin(x)和x
plot sin(x),x
设置、取消轴标签
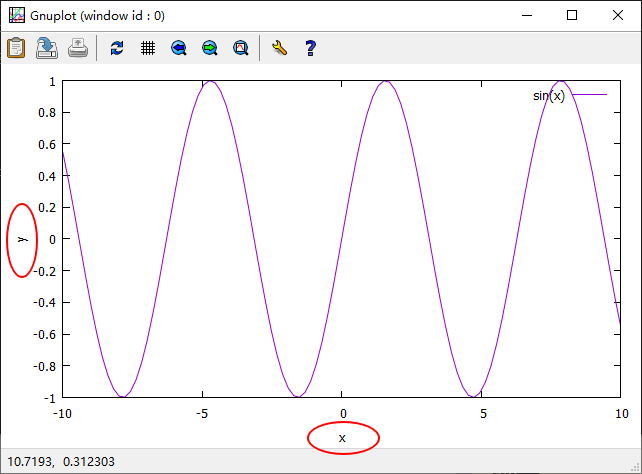
设置轴标签
set xlabel "x"
set ylabel "y"
plot sin(x)
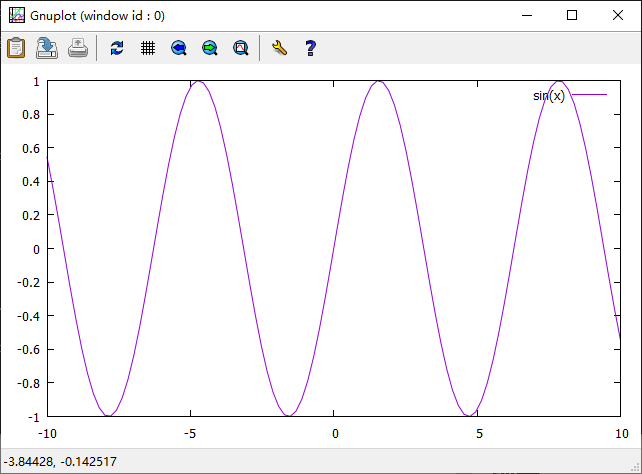
 取消轴标签
取消轴标签
unset xlabel
unset ylabel
plot sin(x)
设置、取消标题
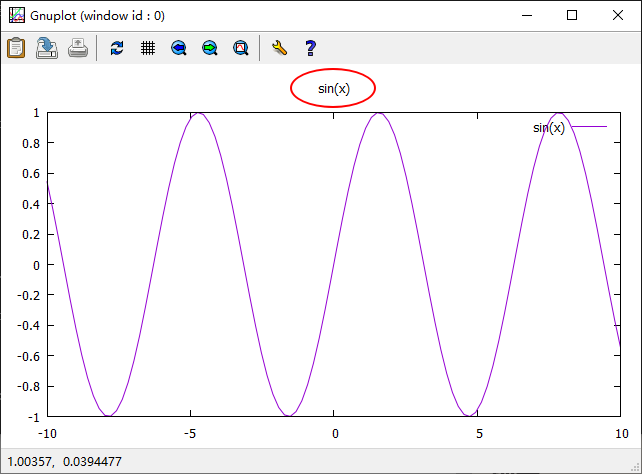
设置标题
set title "sin(x)"
plot sin(x)
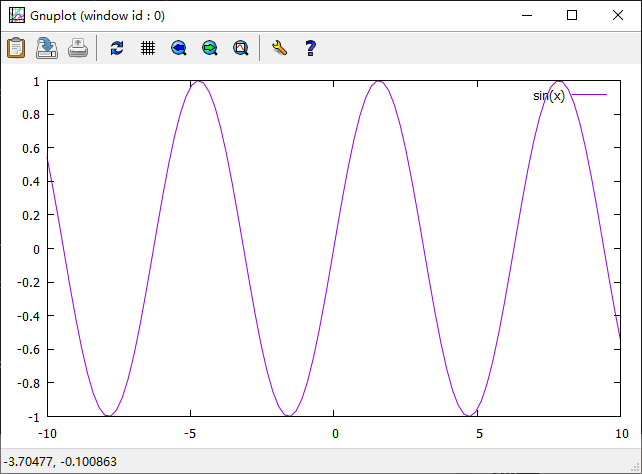
 取消标题
取消标题
unset title
plot sin(x)
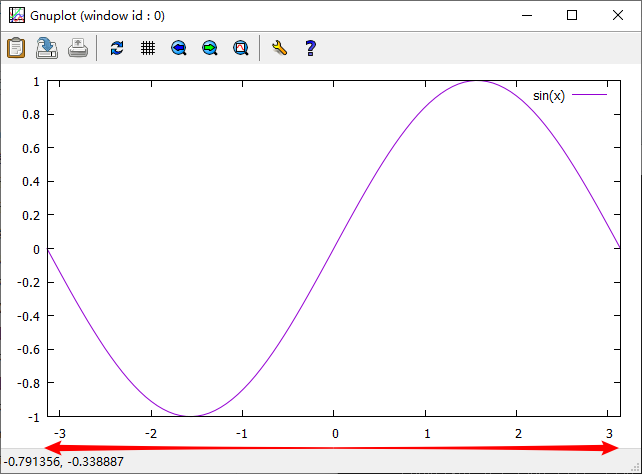
设置X、Y轴范围
x轴默认范围:-10到10
set xrange[-pi:pi]
plot sin(x)
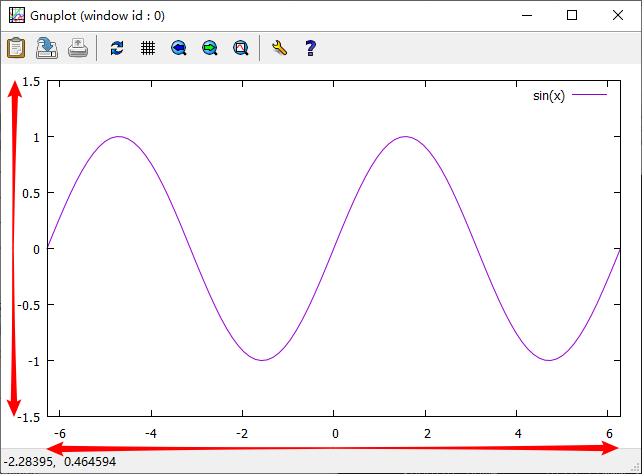
set xrange[-2*pi:2*pi]
set yrange[-1.5:1.5]
plot sin(x)
unset xrange
unset yrange
plot sin(x)
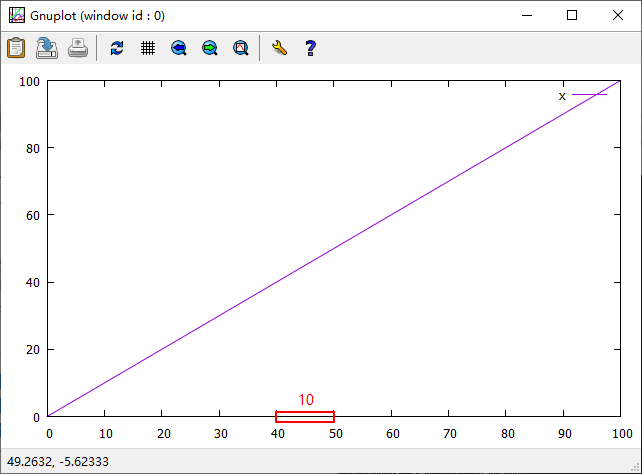
set xrange[0:100]
set xtics 0,10,100
plot x
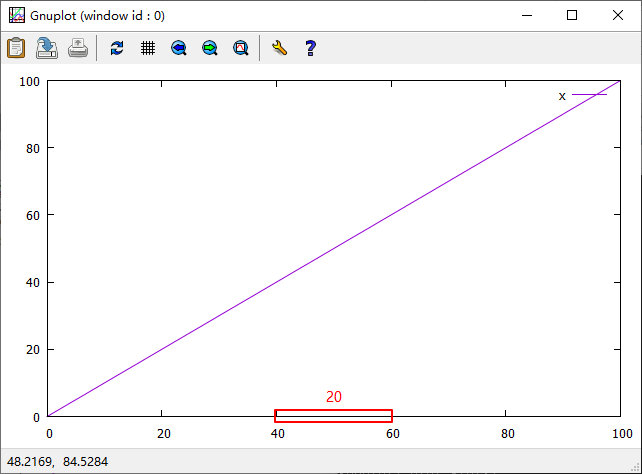
set xrange[0:100]
set xtics 0,20,100
plot x
线画
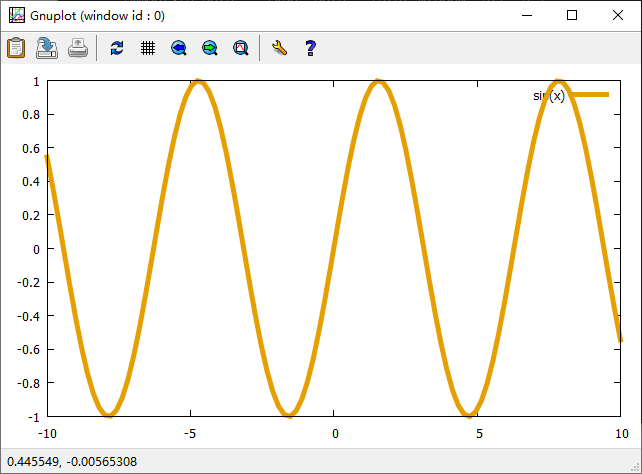
plot sin(x) with line linetype 3 linewidth 2
或简写为:plot sin(x) w l lt 3 lw 2
linetype:线的颜色
linewidth:线的宽度
(读者可以尝试更改linetype和linewidth后的数字,以更改线的颜色和宽度)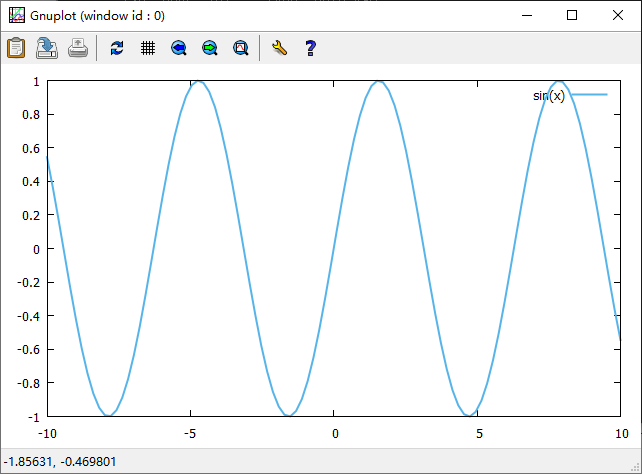
plot sin(x) with line linetype 4 linewidth 2
linetype:线的颜色
linewidth:线的宽度
(读者可以尝试更改linetype和linewidth后的数字,以更改线的颜色和宽度)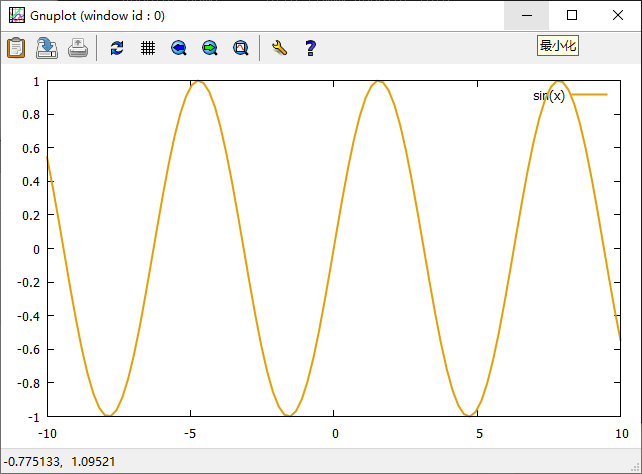
plot sin(x) with line linetype 4 linewidth 5
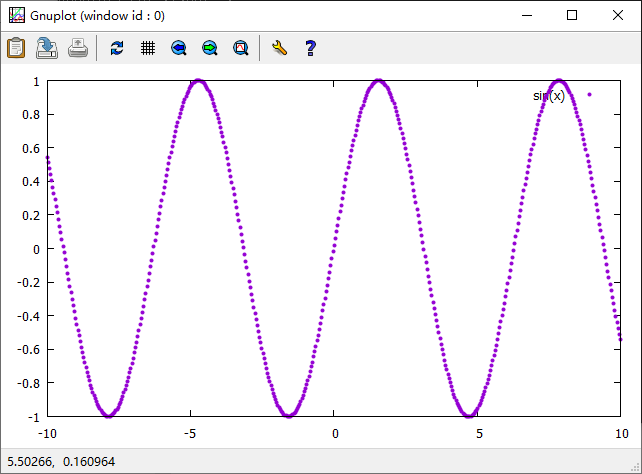
点画
plot sin(x) with point pointtype 2 pointsize 0.5
或简写为:plot sin(x) w p pt 2 ps 0.5
pointtype:点的形状
pointsize:点的大小
(读者可以尝试更改pointtype和pointsize后的数字,以更改点的形状和大小)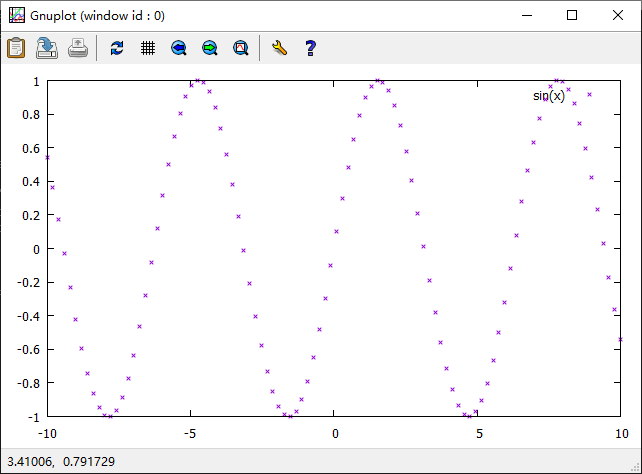
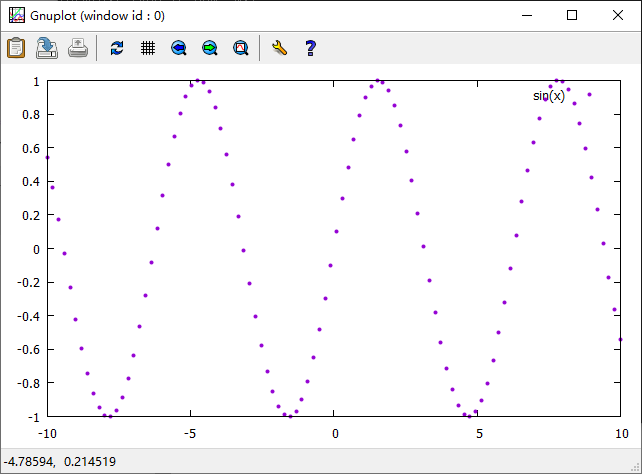
plot sin(x) with point pointtype 7 pointsize 0.5
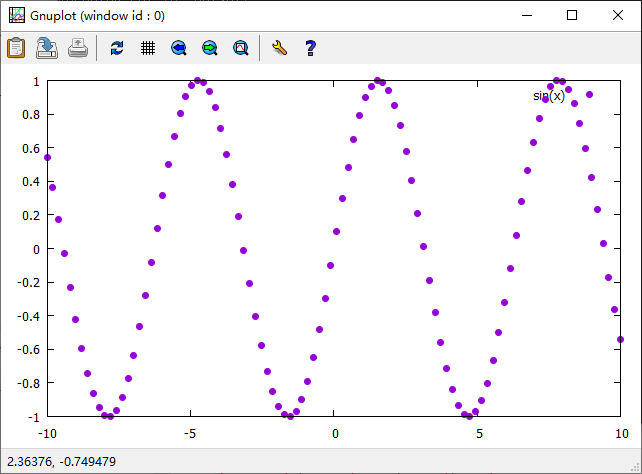
plot sin(x) with point pointtype 7 pointsize 1
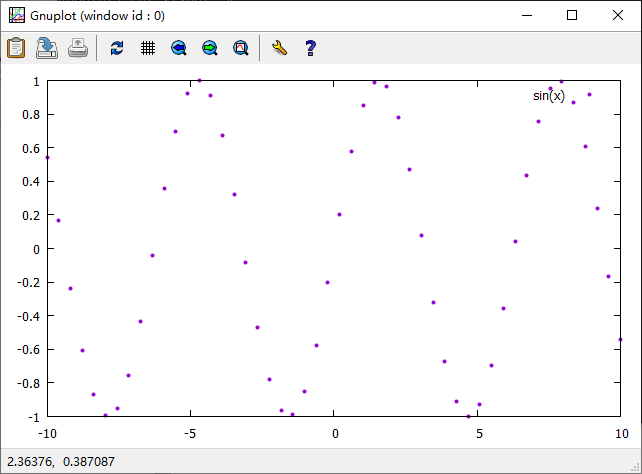
设置样点个数
set samples 50
plot sin(x) with point pointtype 7 pointsize 0.5
set samples 50
plot sin(x) with point pointtype 7 pointsize 0.5
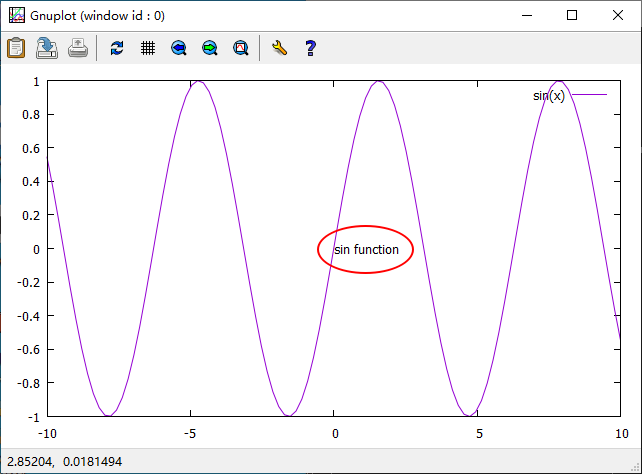
图中添加、取消文字
- 在一处添加文字,然后取消。
set label 'sin function' at 0,0
plot sin(x)
unset label
plot sin(x)
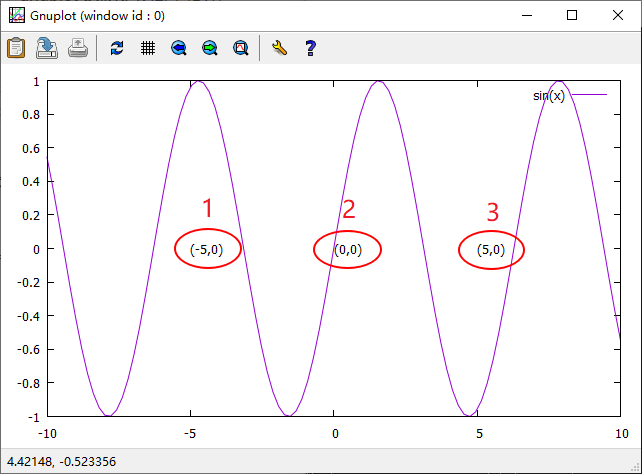
- 在多处添加文字,然后选择性取消。
set label 1 '(-5,0)' at -5,0
set label 2 '(0,0)' at 0,0
set label 3 '(5,0)' at 5,0
plot sin(x)
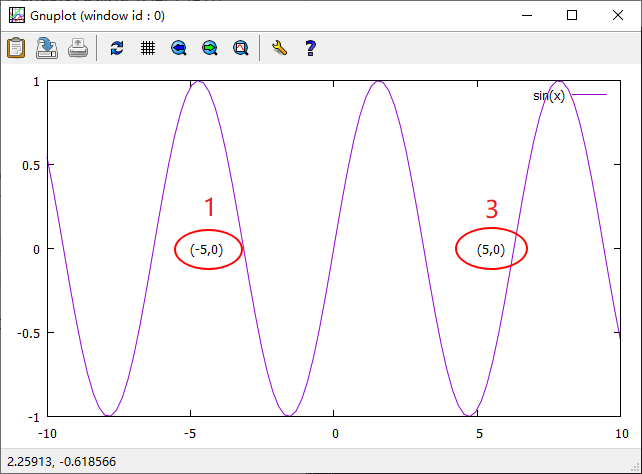
 先取消第2处的文字
unset label 2
plot sin(x)
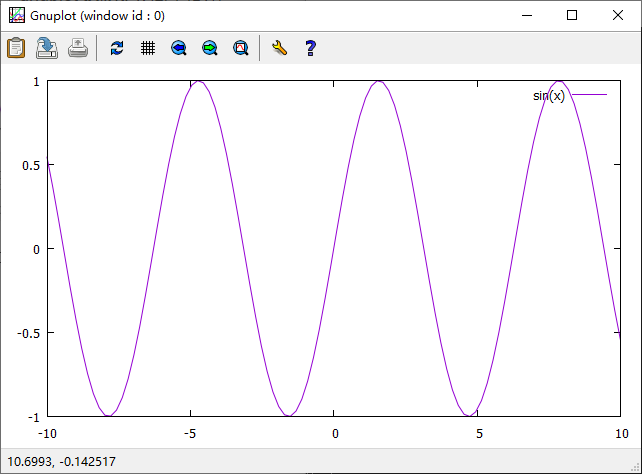
 再取消第1处和第3处的文字
unset label 1
unset label 3
plot sin(x)
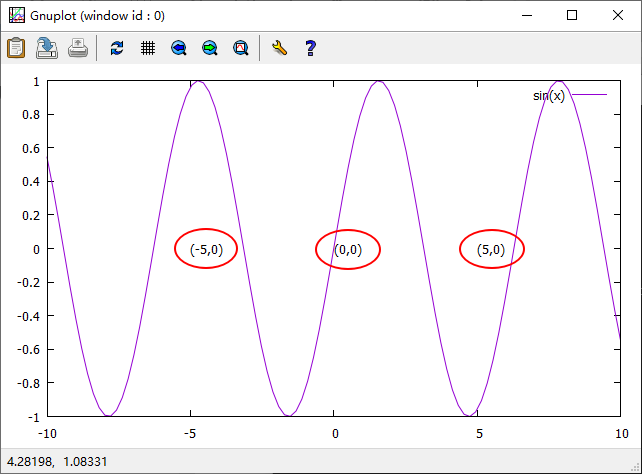
若在使用set label添加文字时未区分1、2、3,则在使用unset label取消文字时3处文字全部被取消。
set label  '(-5,0)' at -5,0
set label  '(0,0)' at 0,0
set label  '(5,0)' at 5,0
plot sin(x)
unset label
plot sin(x)
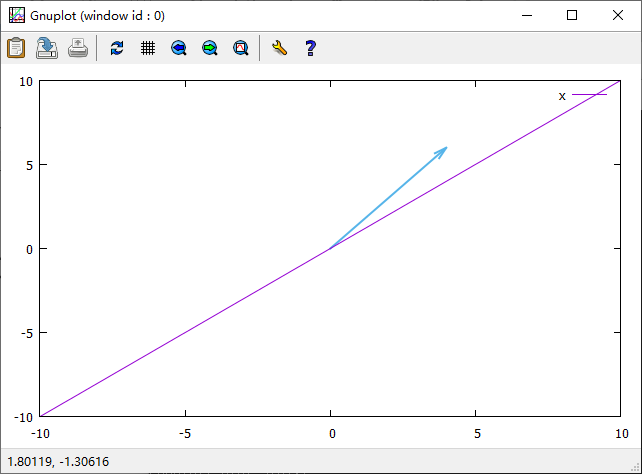
在图中添加、取消箭头或直线
set arrow from 0,0 to 4,6 lt 3 lw 2
plot x
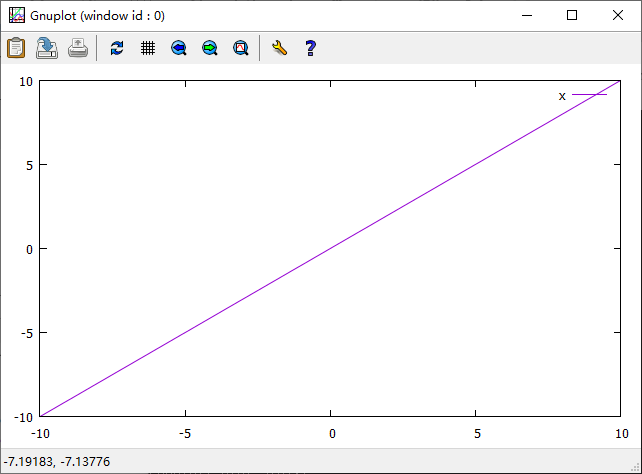
unset arrow
plot x
set arrow from 0,0 to 4,-6 nohead lt 3 lw 2
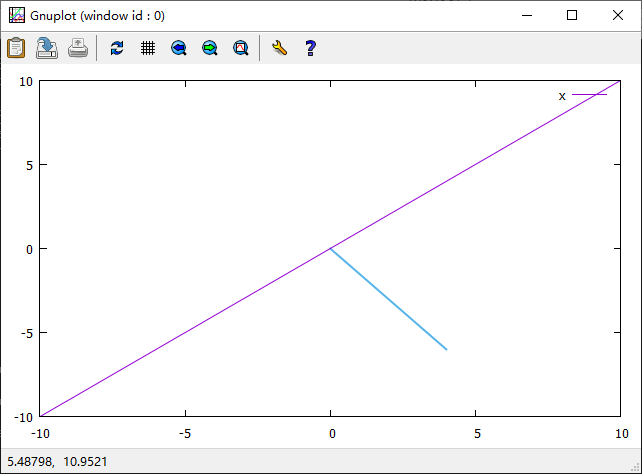
unset arrow
plox x
set arrow from 0,0 to 4,6 lt 3 lw 2
set arrow from 0,0 to 4,-6 nohead lt 5 lw 2
plot x

unset arrow
plox x
 同样,箭头和直线也可以在set arrow命令后加数字区分,以在取消时可以选择性取消。
设置图的大小和位置
图的位置总是以图的左下角为参考
大小(size)默认为:1,1
位置(origin)默认为:0,0
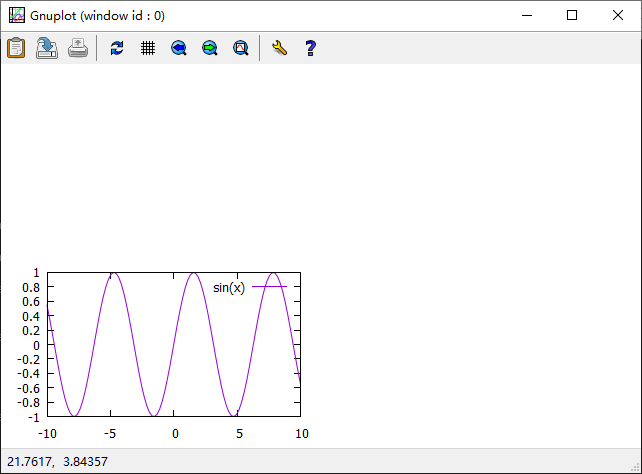
set size 0.5,0.5
plot sin(x)
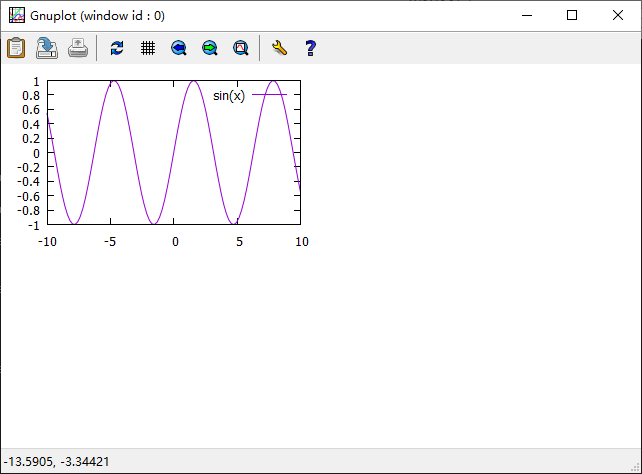
set size 0.5,0.5
set origin 0,0.5
plot sin(x)
set size 1,0.5
set origin 0,0.5
plot sin(x)
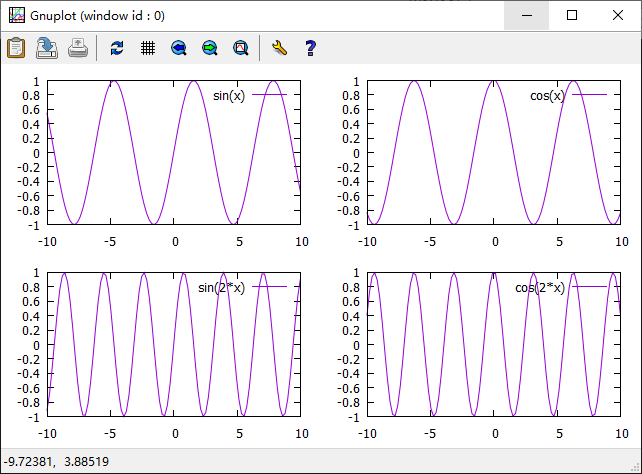
在同一张图里同时画多个图
set multiplot layout 2,2
plot sin(x)
plot cos(x)
plot sin(2*x)
plot cos(2*x)
unset multiplot
该命令将图分为2行2列,画图时按1、2、3、4的顺序依次画图。
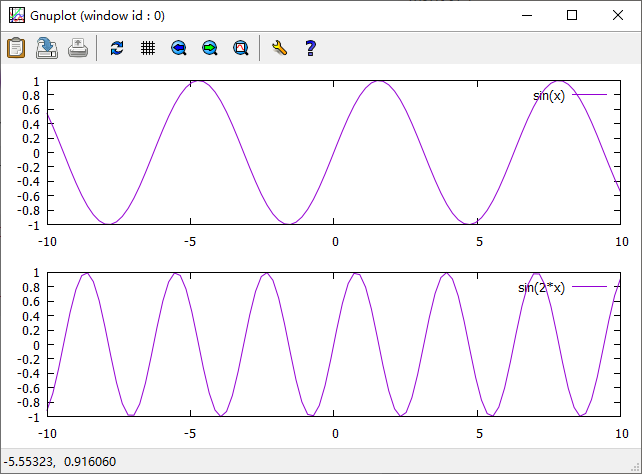
set multiplot layout 2,1
plot sin(x)
plot sin(2*x)
unset multiplot
该命令将图分为2行1列,画图时按1、2的顺序依次画图。
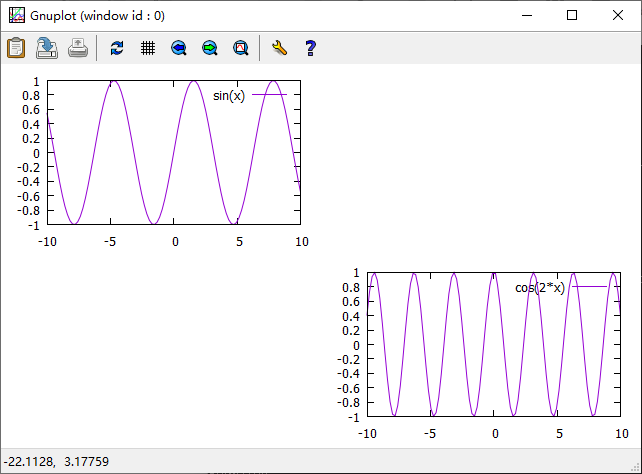
set multiplot
set size 0.5,0.5
set origin 0,0.5
plot sin(x)
set size 0.5,0.5
set origin 0.5,0
plot cos(2*x)
unset multiplot
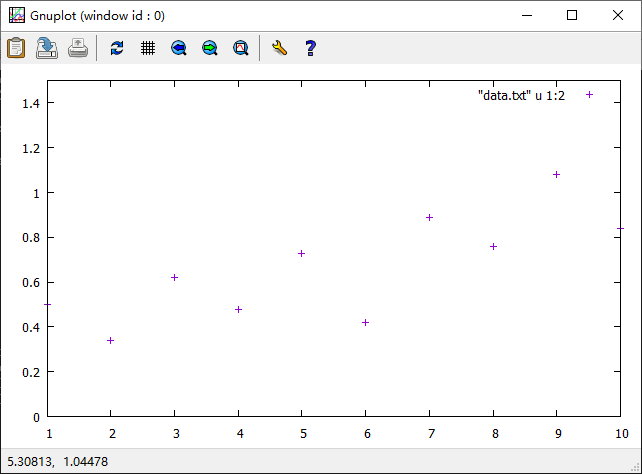
读取文件中的数据并绘图
在E盘根目录下新建data.txt文件并存入以下10组数据,两列数据之间用 Tab键隔开。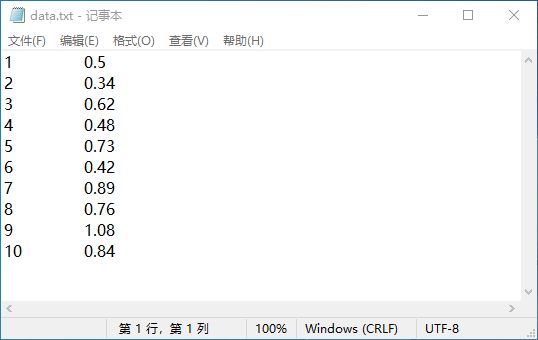
进入cmd命令窗口,使用**E:**命令进入E盘,再使用 gnuplot 命令进入gnuplot。
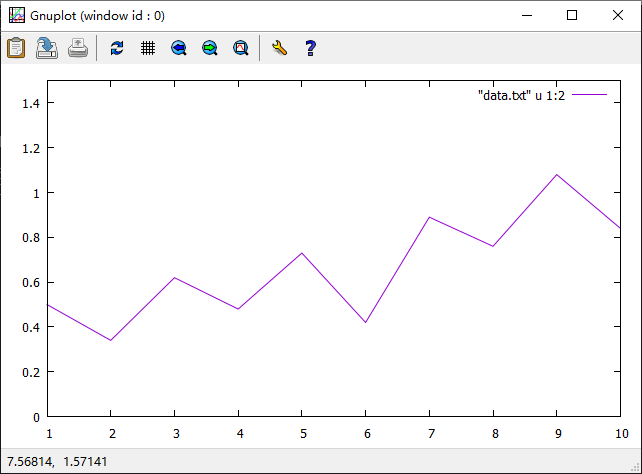
plot [1:10] [0:1.5] "data.txt" u 1:2 w l
plot [1:10] [0:1.5] "data.txt" u 1:2 w p
版权声明:本文为tengfei0973原创文章,遵循CC 4.0 BY-SA版权协议,转载请附上原文出处链接和本声明。