场景: uni-app 小程序使用ECharts,父组件循环渲染折线图子组件,动态获取参数渲染
解决问题: 循环的图表在页面上全部显示最后一项的数据
1.在小程序内引用ECharts
uni-app微信小程序使用ECharts_雪梨 ~的博客-CSDN博客
2.父组件内循环调用子组件
引入子组件
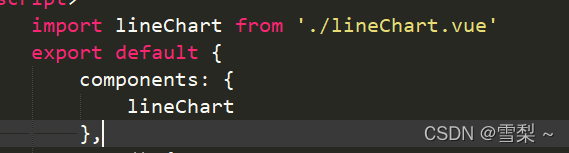
循环子组件传参, chartList 是要循环的个数及数据 可以写在接口中动态获取,格式根据自己的需要调整就可以
<view   style="width: 100%;" v-for="(item,index) of chartList" :key="index">
    <lineChart   ref="lineChart" :lineChart="item.lineChartVlaue"></lineChart>
</view>
chartList: [{
lineChartVlaue: {
title: "图表1",
xdata: ['12/07', '12/08', '12/09', '12/10', '12/11', '12/12', '12/13'],
seriesData: [823, 932, 901, 934, 1290, 1330, 1320],
},
}, {
lineChartVlaue: {
title: "图表2",
xdata: ['12/07', '12/08', '12/09', '12/10', '12/11', '12/12', '12/13'],
seriesData: [822, 932, 901, 934, 1290, 1330, 1320],
},
}, {
lineChartVlaue: {
title: "图表3",
xdata: ['12/07', '12/08', '12/09', '12/10', '12/11', '12/12', '12/13'],
seriesData: [821, 932, 901, 934, 1290, 1330, 1320],
}
}],3.子组件接收数据

遇到的坑: 循环的图表在页面上一直显示最后一项数据
解决方法:需要修改echarts.vue页面
找到onInit方法,在最后加一个参数用于传数据
this.chart = this.onInit(canvas, res.width, res.height,this.tuData); props接收一下
tuData:{
		type: Object,
		default: {}
	}
在使用ECharts的地方要加一下这个参数 :tuData="数据"
此处的lineChart是从父组件穿过来的
<!-- 子组件页面 -->
<my-echarts  :tuData="lineChart" id="main" ref="mapChart" :echarts="echarts" :onInit="initChart" />
这个时候子组件onInit的方法就可以接收到这个参数了,赋值到option对应的数据上就可以了
initChart(canvas, width, height,tuData) {
				chart = echarts.init(canvas, null, {
					width: width,
					height: height
				});
				this.option = {
					title: {
						text: tuData.title,//这里使用的是动态数据
					},
					grid: {
						left: '1%',
						right: '2%',
						bottom: '1%',
						containLabel: true
					},
					xAxis: {
						type: 'category',
						boundaryGap: false,
						data: tuData.xdata,  //这里使用的是动态数据
						axisTick: {
							show: false, //是否显示刻度轴
						},
					},
					yAxis: {
						type: 'value',
						splitLine: {
							show: true,
							lineStyle: {
								color: ['#d8f4e2'], //网格线
								width: 1,
							},
						}
					},

					series: [{
						data: tuData.seriesData,  //这里使用的是动态数据
						type: 'line',
						symbolSize: 12, //实心圆大小
						itemStyle: {
							normal: {
								color: '#00ac25' //折线颜色
							}
						},
						areaStyle: { //阴影颜色
							normal: {
								color: new echarts.graphic.LinearGradient(0, 0, 0, 1, [{
									offset: 0,
									color: '#c7f0d6' //渐变色上方颜色
								}, {
									offset: 1,
									color: '#c7f0d6' //渐变色下方颜色
								}])
							}
						}
					}]
				}; // ECharts 配置项

				chart.setOption(this.option);
				return chart; // 返回 chart 后可以自动绑定触摸操作
			}
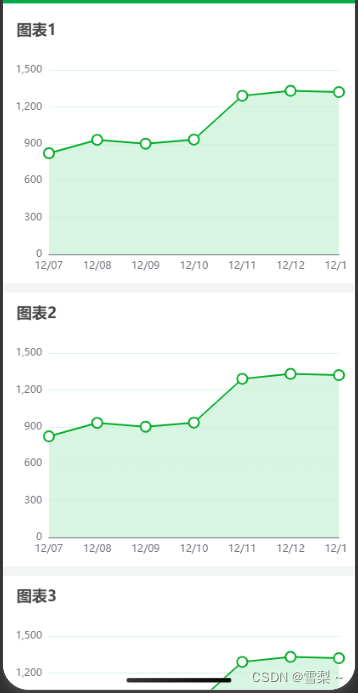
最终效果
子组件页面全部代码
<template>
	<view>
		<view class="echarts-wrap">
			<my-echarts  :tuData="lineChart" id="main" ref="mapChart" :echarts="echarts" :onInit="initChart" />
		</view>
	</view>
</template>

<script>
	import * as echarts from '@/common/echarts.min.js';
	import myEcharts from '@/components/mpvue-echarts/src/echarts.vue';

	let that = null
	let chart = null
	export default {
		components: {
			myEcharts
		},
		props: {
			lineChart: {
				type: Object,
				default: {}
			}
		},

		data() {
			return {
				echarts,
				option: {},
				mylineChart: {}
			}
		},
		onReady() {
			that = this
			uni.hideHomeButton()
		},
		mounted() {
		},
		onLoad() {},
		methods: {
			initChart(canvas, width, height,tuData) {
				chart = echarts.init(canvas, null, {
					width: width,
					height: height
				});
				this.option = {
					title: {
						text: tuData.title
					},
					grid: {
						left: '1%',
						right: '2%',
						bottom: '1%',
						containLabel: true
					},
					xAxis: {
						type: 'category',
						boundaryGap: false,
						data: tuData.xdata,
						axisTick: {
							show: false, //是否显示刻度轴
						},
					},
					yAxis: {
						type: 'value',
						splitLine: {
							show: true,
							lineStyle: {
								color: ['#d8f4e2'], //网格线
								width: 1,
							},
						}
					},

					series: [{
						data: tuData.seriesData,
						type: 'line',
						symbolSize: 12, //实心圆大小
						itemStyle: {
							normal: {
								color: '#00ac25' //折线颜色
							}
						},
						areaStyle: { //阴影颜色
							normal: {
								color: new echarts.graphic.LinearGradient(0, 0, 0, 1, [{
									offset: 0,
									color: '#c7f0d6' //渐变色上方颜色
								}, {
									offset: 1,
									color: '#c7f0d6' //渐变色下方颜色
								}])
							}
						}
					}]
				}; // ECharts 配置项

				chart.setOption(this.option);
				// this.$refs.mapChart.setChart(chart);
				return chart; // 返回 chart 后可以自动绑定触摸操作
			}
		}
	}
</script>

<style>
	.echarts-wrap {
		width: 100%;
		height: 300px;
	}
</style>
echarts.vue页面全部代码
<template>
  <canvas v-if="canvasId" class="ec-canvas" :id="canvasId" :canvasId="canvasId" @touchstart="touchStart" @touchmove="touchMove" @touchend="touchEnd" @error="error"></canvas>
</template>

<script>
import WxCanvas from './wx-canvas';
import * as echarts from '@/common/echarts.min.js';

export default {
  props: {
    // echarts: {
    //   required: true,
    //   type: Object,
    //   default() {
    //     return echarts;
    //   }
    // },
    onInit: {
      required: true,
      type: Function,
      default: null
    },
    canvasId: {
      type: String,
      default: 'ec-canvas'
    },
    lazyLoad: {
      type: Boolean,
      default: false
    },
    disableTouch: {
      type: Boolean,
      default: false
    },
    throttleTouch: {
      type: Boolean,
      default: false
    } ,
	tuData:{
		type: Object,
		default: {}
	}
  },
  onReady() {
    this.echarts = echarts;

    if (!this.echarts) {
      console.warn('组件需绑定 echarts 变量,例:<ec-canvas id="mychart-dom-bar" ' + 'canvas-id="mychart-bar" :echarts="echarts"></ec-canvas>');
      return;
    }

    // console.log('echarts');
    // console.log(this.onInit);

    if (!this.lazyLoad) this.init();
  },
  methods: {
    init() {
      const version = wx.version.version.split('.').map(n => parseInt(n, 10));
      const isValid = version[0] > 1 || (version[0] === 1 && version[1] > 9) || (version[0] === 1 && version[1] === 9 && version[2] >= 91);
      if (!isValid) {
        console.error('微信基础库版本过低,需大于等于 1.9.91。' + '参见:https://github.com/ecomfe/echarts-for-weixin' + '#%E5%BE%AE%E4%BF%A1%E7%89%88%E6%9C%AC%E8%A6%81%E6%B1%82');
        return;
      }

      if (!this.onInit) {
        console.warn('请传入 onInit 函数进行初始化');
        return;
      }

      const canvasId = this.canvasId;
      this.ctx = wx.createCanvasContext(canvasId,this);

      const canvas = new WxCanvas(this.ctx, canvasId);

      this.echarts.setCanvasCreator(() => canvas);

      const query = wx.createSelectorQuery().in(this);
      query
        .select(`#${canvasId}`)
        .boundingClientRect(res => {
          if (!res) {
            //setTimeout(() => this.init(), 200);
            return;
          }
          this.chart = this.onInit(canvas, res.width, res.height,this.tuData);
        })
        .exec();
    },
    canvasToTempFilePath(opt) {
      const { canvasId } = this;
      this.ctx.draw(true, () => {
        wx.canvasToTempFilePath({
          canvasId,
          ...opt
        });
      });
    },
    touchStart(e) {
      const { disableTouch, chart } = this;
      if (disableTouch || !chart || !e.mp.touches.length) return;
      const touch = e.mp.touches[0];
      chart._zr.handler.dispatch('mousedown', {
        zrX: touch.x,
        zrY: touch.y
      });
      chart._zr.handler.dispatch('mousemove', {
        zrX: touch.x,
        zrY: touch.y
      });
    },
    touchMove(e) {
      const { disableTouch, throttleTouch, chart, lastMoveTime } = this;
      if (disableTouch || !chart || !e.mp.touches.length) return;

      if (throttleTouch) {
        const currMoveTime = Date.now();
        if (currMoveTime - lastMoveTime < 240) return;
        this.lastMoveTime = currMoveTime;
      }

      const touch = e.mp.touches[0];
      chart._zr.handler.dispatch('mousemove', {
        zrX: touch.x,
        zrY: touch.y
      });
    },
    touchEnd(e) {
      const { disableTouch, chart } = this;
      if (disableTouch || !chart) return;
      const touch = e.mp.changedTouches ? e.mp.changedTouches[0] : {};
      chart._zr.handler.dispatch('mouseup', {
        zrX: touch.x,
        zrY: touch.y
      });
      chart._zr.handler.dispatch('click', {
        zrX: touch.x,
        zrY: touch.y
      });
    }
  }
};
</script>

<style scoped>
.ec-canvas {
  width: 100%;
  height: 100%;
  flex: 1;
}
</style> 版权声明:本文为weixin_45574552原创文章,遵循CC 4.0 BY-SA版权协议,转载请附上原文出处链接和本声明。