1、通过npm安装ECharts
npm install echarts --save
2、上代码
<template>
  <h1>ECharts 示例</h1>
  <div ref="echartsBar" class="echarts"></div>
  <div ref="echartsPie" class="echarts"></div>
</template>

<script setup>
import { ref, onMounted } from "vue";
// 引入echarts
import * as echarts from "echarts";

// 柱状图dom容器
const echartsBar = ref();
// 饼状图dom容器
const echartsPie = ref();
// 当前时间
const currentTime = ref("");
// 页面加载完成调用ECharts初始化
onMounted(() => {
  currentTime.value = getDateTime();
  initBar();
  initPie();
});

// 柱状图
const initBar = () => {
  // 初始化ECharts
  let myChart = echarts.init(echartsBar.value);
  // 图表配置项和数据
  let option = {
    title: {
      text: "ECharts之柱状图",
      left: "center",
    },
    xAxis: {
      type: "category",
      data: ["Mon", "Tue", "Wed", "Thu", "Fri", "Sat", "Sun"],
    },
    yAxis: {
      type: "value",
    },
    series: [
      {
        data: [120, 200, 150, 80, 70, 110, 130],
        type: "bar",
      },
    ],
  };
  // 设置图表配置显示图表实例
  myChart.setOption(option);
};

const initPie = () => {
  // 初始化ECharts
  let myChart = echarts.init(echartsPie.value);
  // 图表配置项和数据
  let option = {
    title: {
      text: "ECharts之饼状图",
      subtext: currentTime.value,
      left: "center",
    },
    tooltip: {
      trigger: "item",
    },
    legend: {
      orient: "vertical",
      left: "left",
    },
    series: [
      {
        name: "Access From",
        type: "pie",
        radius: "50%",
        data: [
          { value: 1048, name: "Search Engine" },
          { value: 735, name: "Direct" },
          { value: 580, name: "Email" },
          { value: 484, name: "Union Ads" },
          { value: 300, name: "Video Ads" },
        ],
        emphasis: {
          itemStyle: {
            shadowBlur: 10,
            shadowOffsetX: 0,
            shadowColor: "rgba(0, 0, 0, 0.5)",
          },
        },
      },
    ],
  };
  // 设置图表配置显示图表实例
  myChart.setOption(option);
};

// 获取当前日期时间
const getDateTime = () => {
  let date = new Date();
  let hengGang = "-";
  let maoHao = ":";
  let year = date.getFullYear();
  let month = date.getMonth() + 1;
  let curDate = date.getDate();
  let curHours = date.getHours();
  let curMinutes = date.getMinutes();
  let curSeconds = date.getSeconds();

  if (month >= 1 && month <= 9) {
    month = "0" + month;
  }
  if (curDate >= 0 && curDate <= 9) {
    curDate = "0" + curDate;
  }
  if (curHours >= 0 && curHours <= 9) {
    curHours = "0" + curHours;
  }
  if (curMinutes >= 0 && curMinutes <= 9) {
    curMinutes = "0" + curMinutes;
  }
  if (curSeconds >= 0 && curSeconds <= 9) {
    curSeconds = "0" + curSeconds;
  }
  let currentdate =
    year +
    hengGang +
    month +
    hengGang +
    curDate +
    " " +
    curHours +
    maoHao +
    curMinutes +
    maoHao +
    curSeconds;
  return currentdate;
};
</script>

<style scoped>
.echarts {
    width: 800px;
    height: 400px;
    margin: auto;
}
</style>
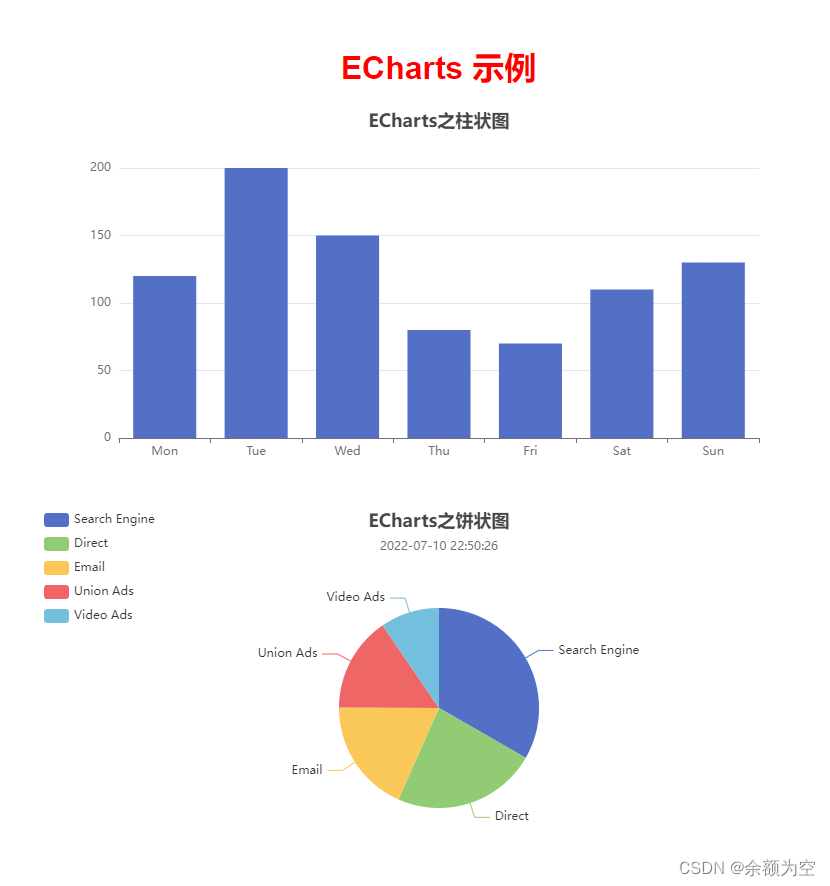
3、效果展示
版权声明:本文为qq_39772898原创文章,遵循CC 4.0 BY-SA版权协议,转载请附上原文出处链接和本声明。