场景
聚合显示、自定义图层图标点等
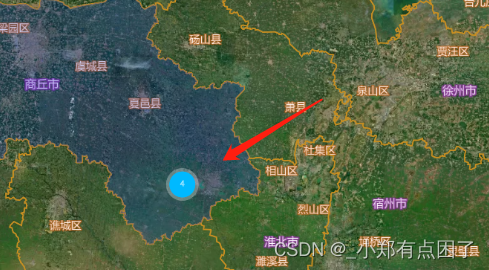
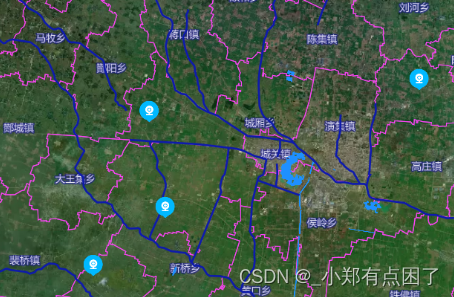
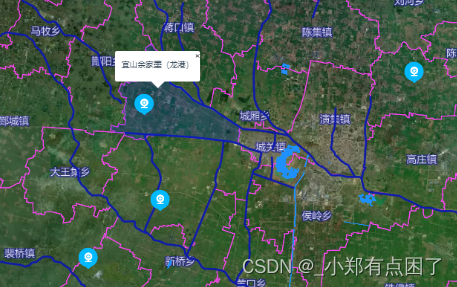
效果图
代码实现
假设已经初始化地图完成,开始进行操作
//查询数据-摄像头
        async getAllCameraInfo(){

            let res = {
              data:[
                {
                  gmtCreated: "2022-03-16 15:09:37",
                  gmtModified: "2022-03-16 15:12:06",
                  id: null,
                  indexCode: "ff8080817b0d9c18017b0ec573560001",
                  lat: 33.971199372800456,
                  lng: 116.24850619967219,
                  name: "宜山余家墨(龙港)",
                },
                {
                  gmtCreated: "2022-03-16 15:09:37",
                  gmtModified: "2022-03-16 15:12:06",
                  id: null,
                  indexCode: "ff8080817b0d9c18017b0ec573560001",
                  lat: 33.841680980672564,
                  lng: 116.19175863704055,
                  name: "宜山余家墨(龙港)",
                },
                {
                  gmtCreated: "2022-03-16 15:09:37",
                  gmtModified: "2022-03-16 15:12:06",
                  id: null,
                  indexCode: "ff8080817b0d9c18017b0ec573560001",
                  lat: 33.89048373379242,
                  lng: 116.26471978899235,
                  name: "宜山余家墨(龙港)",
                },
                {
                  gmtCreated: "2022-03-16 15:09:37",
                  gmtModified: "2022-03-16 15:12:06",
                  id: null,
                  indexCode: "ff8080817b0d9c18017b0ec573560001",
                  lat: 33.998087580885866,
                  lng: 116.52211051948859,
                  name: "宜山余家墨(龙港)",
                },
              ]
            }

              let json = {
                type: "FeatureCollection",
                crs: {
                  type: "name",
                  properties: { name: "urn:ogc:def:crs:OGC:1.3:CRS84" },
                },
                features: [],
              };
              res.data.forEach((item) => {
                let params = {
                  type: "Feature",
                  properties: item,
                  geometry: {
                    coordinates:[item.lng*1,item.lat*1],
                    type:'Point'
                  },
                };
                json.features.push(params);
              });
              this.addCluster(json);
        },
        addCluster: function (data) {
          let map = this.map;
          map.off("click", "plant-point",this.flagClickHandler);
          if (map.getLayer('plantClusters')) map.removeLayer('plantClusters');
          if (map.getLayer('plant-point')) map.removeLayer('plant-point');
          if (map.getLayer('cluster-plant-count')) map.removeLayer('cluster-plant-count');

          if (map.getLayer('localLightIcon-point')) map.removeLayer('localLightIcon-point');//高亮点

          if (map.getSource('earthquakes')) {
            /*map.getSource('earthquakes').removeSource()*/
            map.removeSource('earthquakes')
          }
            map.addSource("earthquakes", {
              type: "geojson",
              data: data,// "https://docs.mapbox.com/mapbox-gl-js/assets/earthquakes.geojson",
              cluster: true,
              clusterMaxZoom: 15, //最大缩放到群集点
              clusterRadius: 100 // 每一组点的半径(=50)
            });

          // 外围有数字的圆圈,加晕染
          map.addLayer({
            id: "plantClusters",
            type: "circle",
            // minzoom: 12,
            source: "earthquakes",
            filter: ["has", "point_count"],
            paint: {
              //*蓝色,当点数小于100时为20px圆
              //!*点计数在100到750之间时为黄色,21px圆
              //!*点计数大于或等于750时为22像素的粉红色圆圈
              "circle-color": [
                "step",
                ["get", "point_count"],
                "#00B9FF",
                20,
                "#00B9FF"
              ],
              "circle-radius": [
                "step",
                ["get", "point_count"],
                20, //蓝色,当点数小于100时为20px圆
                100, //对应上面circle-color 数字,意思为100以内
                21, //点计数在100到750之间时为黄色,21px圆
                750, //对应上面circle-color 数字,意思为750以内
                22 //点计数大于或等于750时为22像素的粉红色圆圈
              ],
              // 这个是外边框的颜色 circle-stroke-color这个对应了上面circle-color
              "circle-stroke-color": [
                "step",
                ["get", "point_count"],
                "rgba(255, 255, 255, 0.3)",
                100,
                "rgba(255, 255, 255, 0.3)",
                750,
                "rgba(255, 255, 255, 0.3)"
              ],
              "circle-stroke-width": [
                "step",
                ["get", "point_count"],
                5, //蓝色晕染长度,当点数小于100时为5px晕染
                100, //对应上面circle-color 数字,意思为100以内
                6, //点计数在100到750之间时为黄色,6px晕染
                750, //对应上面circle-color 数字,意思为750以内
                7 //点计数大于或等于750时为7px像素的粉红色晕染
              ]
            }
          });
          //聚合图圆圈中的数字
          map.addLayer({
            id: "cluster-plant-count",
            type: "symbol",
            // minzoom: 12,
            source: "earthquakes",
            filter: ["has", "point_count"],
            layout: {
              "text-field": "{point_count_abbreviated}",
              "text-font": ["FZHei-B01S Regular"],
              "text-size": 12
            },
            // 添加这个就可以改变圆圈内字样式,这里我改变了他的颜色
            paint: {
              "text-color": "#fff",
              "text-opacity": 1
            }
          });

          let that = this;
          map.loadImage(
            that.markerIcon, /*图片地址*/
            function (error, image) {
              if (error) throw error;
              /*1.加载红旗图标*/
              if(map.hasImage('redFlg')){  map.removeImage('redFlg'); }
              map.addImage('redFlg', image); /*, {sdf: true}*/

              /*2添加小点*/
              map.addLayer({
                id: 'plant-point',
                type: 'symbol',
                source: 'earthquakes',
                // minzoom: 12,
                filter: ['!',['has', 'point_count']],
                'layout': {
                  'icon-image': 'redFlg',
                  'icon-size': 0.4,
                },
              });
            }
          );

          map.on("click", "plant-point", that.flagClickHandler);
          map.on("mouseenter", "plant-point", that.flagMouseEnter);
          map.on("mouseleave", "plant-point", that.flagMouseLeave);

          // 单击时检查群集
          map.on("click", "plantClusters", function (e) {
            var features = map.queryRenderedFeatures(e.point, {
              layers: ["plantClusters"]
            });
            var clusterId = features[0].properties.cluster_id;
            let prevZoom = map.getZoom();
            map.getSource("earthquakes")
              .getClusterExpansionZoom(clusterId, function (err, zoom) {
                if (err) return;
                if(prevZoom>=15 && prevZoom<19.5) zoom = zoom+1
                map.easeTo({
                  center: features[0].geometry.coordinates,
                  zoom: zoom
                });
                prevZoom = zoom;
              });
          });

          map.on("mouseenter", "plantClusters", function () {
            map.getCanvas().style.cursor = "pointer";
          });
          map.on("mouseleave", "plantClusters", function () {
            map.getCanvas().style.cursor = "";
          });
        },

        flagClickHandler(e){
          let map = this.map;
          var features = map.queryRenderedFeatures(e.point, {
            layers: ["plant-point"]
          });
          var properties = features[0].properties;

          this.drawMarker(properties)
        },
        flagMouseEnter(e){
          let map = this.map;
          var features = map.queryRenderedFeatures(e.point, {
            layers: ["plant-point"]
          });
          var obj = features[0].properties;
          currentPopup = new mapboxgl.Popup({ offset: [20, -25] })
              .setLngLat([obj.lng, obj.lat])
              .setText(obj.name)
              .addTo(map);
        },
        flagMouseLeave(e){
          currentPopup.remove();
        },

        drawMarker(obj) {
          if(this.marker){
            this.marker.remove()
          }
          let map = this.map;
          this.showVideoDialog(obj.name,obj.playUrl);
          let position = [obj.lng, obj.lat]

          // add marker to map
          this.marker = new mapboxgl.Marker("plant-point", { offset: [20, -20] })
            .setLngLat(position)
            .addTo(map);
        },


// 清除当前的图层
        clearCurLayer: function () {
        let map = this.map;
        if (map.getLayer('plantClusters')) map.removeLayer('plantClusters');
        if (map.getLayer('plant-point')) map.removeLayer('plant-point');
        if (map.getLayer('cluster-plant-count')) map.removeLayer('cluster-plant-count');

        if (map.getLayer('localLightIcon-point')) map.removeLayer('localLightIcon-point');//高亮点

        },
版权声明:本文为qq_44706619原创文章,遵循CC 4.0 BY-SA版权协议,转载请附上原文出处链接和本声明。