使用 plot() 绘制折线图
import matplotlib.pyplot as plt
import numpy as np
x = np.arange(4, 19)
y_max = np.array([32, 33, 34, 34, 33, 31, 30, 29, 30, 29, 26, 23, 21, 25, 31])
y_min = np.array([19, 19, 20, 22, 22, 21, 22, 16, 18, 18, 17, 14, 15, 16, 16])
# 绘制折线图
plt.plot(x, y_max)
plt.plot(x, y_min)
plt.show()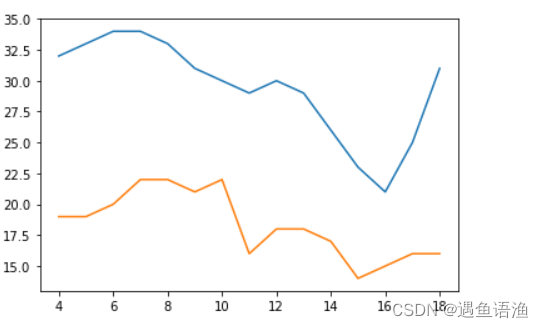
使用 bar() 绘制柱形图或堆积柱形图
import numpy as np
import matplotlib.pyplot as plt
x = np.arange(5)
y1 = np.array([10, 8, 7, 11, 13])
# 柱形的宽度
bar_width = 0.3
# 绘制柱形图
plt.bar(x, y1, tick_label=['a', 'b', 'c', 'd', 'e'], width=bar_width)
plt.show()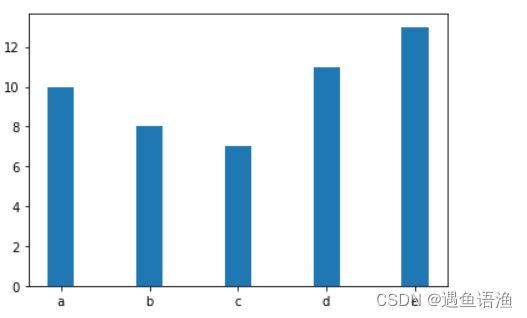
x = np.arange(5)
y1 = np.array([10, 8, 7, 11, 13])
y2 = np.array([9, 6, 5, 10, 12])
# 柱形的宽度
bar_width = 0.3
# 根据多组数据绘制柱形图
plt.bar(x, y1, tick_label=['a', 'b', 'c', 'd', 'e'], width=bar_width)
plt.bar(x+bar_width, y2, width=bar_width)
plt.show() 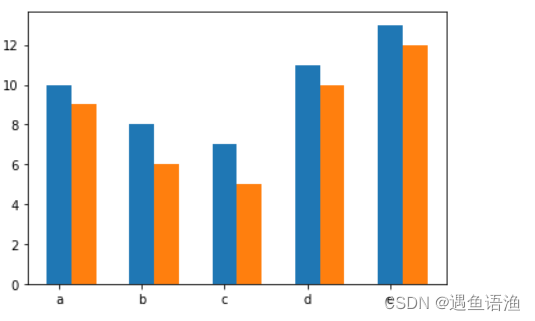
plt.bar(x, y1, tick_label=['a', 'b', 'c', 'd', 'e'], width=bar_width)
plt.bar(x, y2, bottom=y1, width=bar_width)
plt.show() 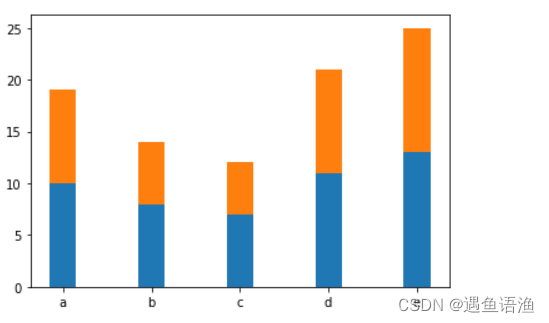
error = [2, 1, 2.5, 2, 1.5]
# 绘制带有误差棒的柱形图
plt.bar(x, y1, tick_label=['a', 'b', 'c', 'd', 'e'], width=bar_width)
plt.bar(x, y1, bottom=y1, width=bar_width, yerr=error)
plt.show() 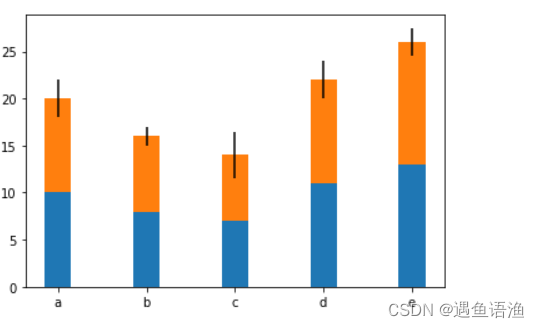
import matplotlib.pyplot as plt
import numpy as np
x = np.arange(1, 8)
y = np.array([10770, 16780, 24440, 30920, 37670, 48200, 57270])
# 绘制柱形图
plt.bar(x, y, tick_label=["FY2013", "FY2014", "FY2015","FY2016", "FY2017", "FY2018", "FY2019"], width=0.5)
plt.show()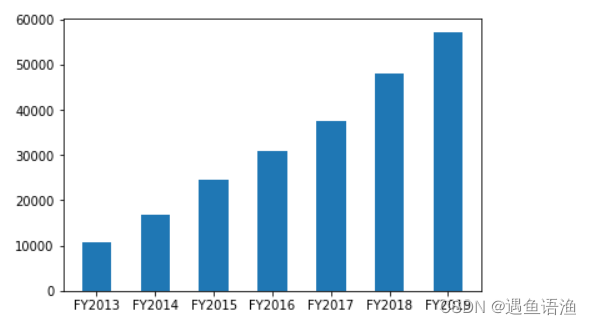
绘制条形图或堆积条形图
import numpy as np
import matplotlib.pyplot as plt
x = np.arange(5)
y = np.array([10, 8, 7, 11, 13])
# 条形的高度
bar_height = 0.3
# 绘制条形图
plt.barh(x, y, tick_label=['a', 'b', 'c', 'd', 'e'], height=bar_height)
plt.show()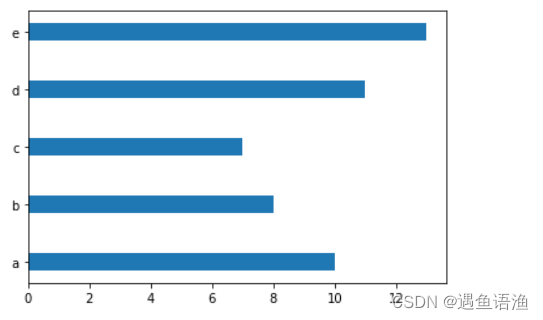
y = np.arange(5)
x1 = np.array([10, 8, 7, 11, 13])
x2 = np.array([9, 6, 5, 10, 12])
# 条形的高度
bar_height = 0.3
# 根据多组数据绘制条形图
plt.barh(y, x1, tick_label=['a', 'b', 'c', 'd', 'e'], height=bar_height)
plt.barh(y+bar_height, x2, height=bar_height)
plt.show()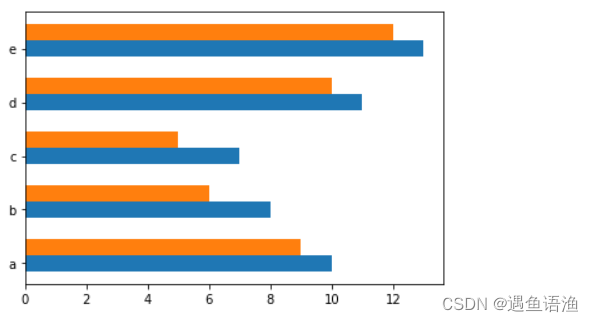
plt.barh(y, x1, tick_label=['a', 'b', 'c', 'd', 'e'], height=bar_height)
plt.barh(y, x2, left=x1, height=bar_height)
plt.show() 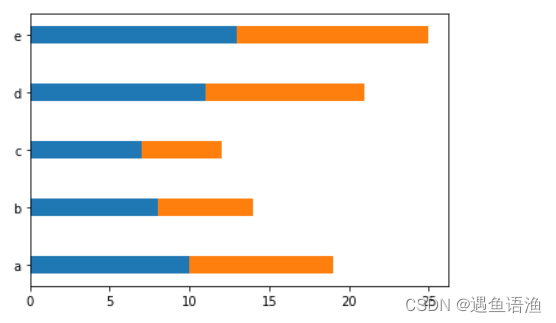
error = [2, 1, 2.5, 2, 1.5]
# 绘制带有误差棒的条形图
plt.barh(y, x1, tick_label=['a', 'b', 'c', 'd', 'e'], height=bar_height)
plt.barh(y, x2, left=x1, height=bar_height, xerr=error)
plt.show() 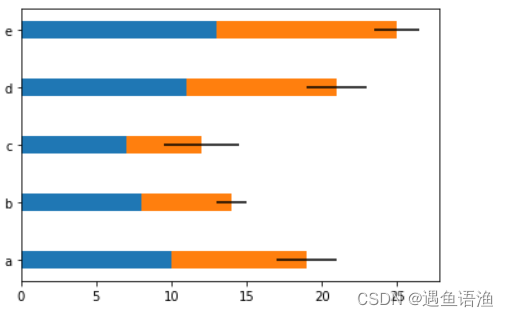
import matplotlib.pyplot as plt
import numpy as np
# 显示中文
plt.rcParams['font.sans-serif'] = ['SimHei']
plt.rcParams['axes.unicode_minus'] = False
x = np.array([0.959, 0.951, 0.935, 0.924, 0.893,0.892, 0.865, 0.863, 0.860, 0.856, 0.854, 0.835, 0.826, 0.816, 0.798, 0.765, 0.763, 0.67])
y = np.arange(1, 19)
labels = [" 家政、家教、保姆等生活服务 ", " 飞机票、火车票 ", " 家具 ", " 手机、手机配件 ", " 计算机及其配套产品 ", " 汽车用品 ", " 通信充值、 游戏充值 ", " 个人护理用品 ", " 书报杂志及音像制品 ", " 餐饮、 旅游、 住宿 ", " 家用电器 ",  " 食品、 饮料、 烟酒、 保健品 ", " 家庭日杂用品 ", " 保险、 演出票务 ", " 服装、鞋帽、家用纺织品 ", " 数码产品 ", " 其他商品和服务 ", " 工艺品、收藏品 "]
# 绘制条形图
plt.barh(y, x, tick_label=labels, align="center", height=0.6)
plt.show() 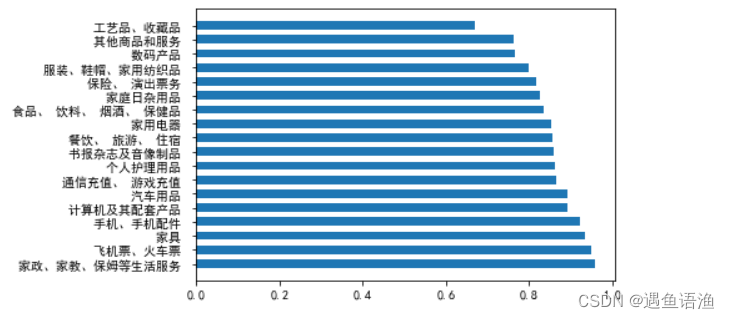
使用 stackplot() 绘制堆积面积图
import numpy as np
import matplotlib.pyplot as plt
x = np.arange(6)
y1 = np.array([1,4,3,5,6,7])
y2 = np.array([1,3,4,2,7,6])
y3 = np.array([3,4,3,6,5,5])
# 绘制堆积面积图
plt.stackplot(x, y1, y2, y3)
plt.show()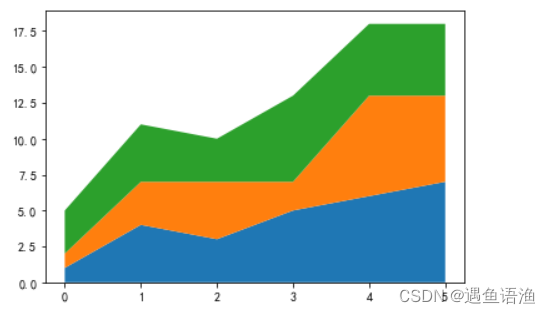
import numpy as np
import matplotlib.pyplot as plt
x = np.arange(1, 13)
y_a = np.array([198, 215, 245, 222, 200, 236, 201, 253, 236, 200, 266, 290])
y_b = np.array([203, 236, 200, 236, 269, 216, 298, 333, 301, 349, 360, 368])
y_c = np.array([185, 205, 226, 199, 238, 200, 250, 209, 246, 219, 253, 288])
# 绘制堆积面积图
plt.stackplot(x, y_a, y_b, y_c)
plt.show() 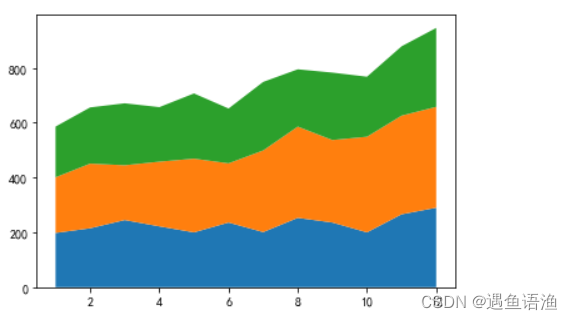
版权声明:本文为weixin_45451576原创文章,遵循CC 4.0 BY-SA版权协议,转载请附上原文出处链接和本声明。