话不多说,上图
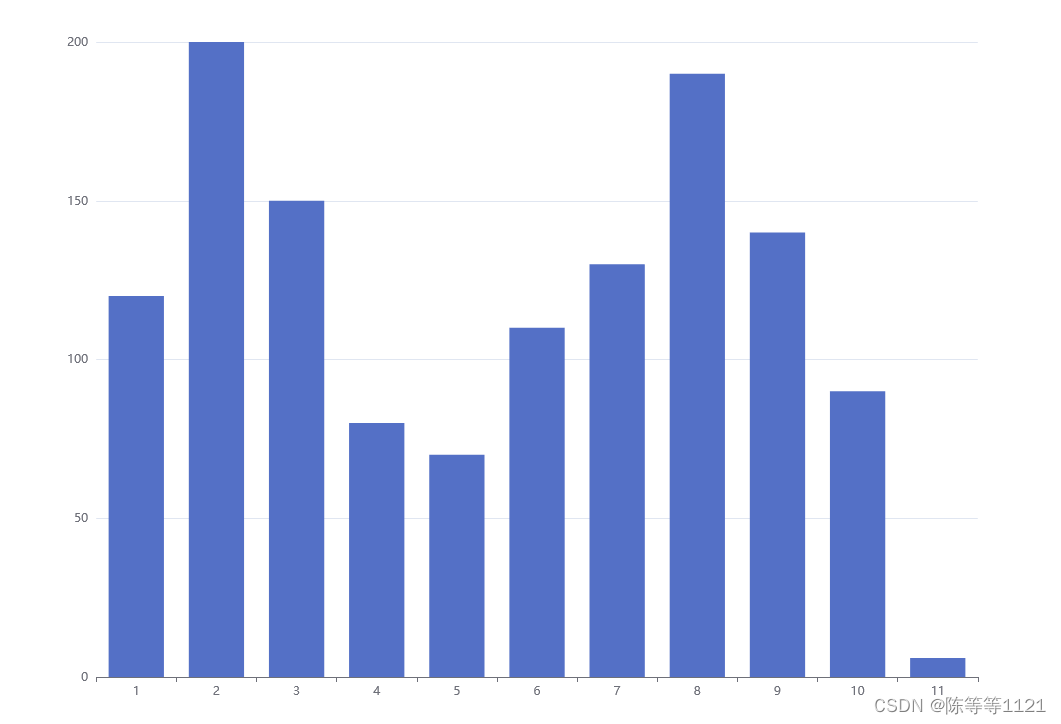
echarts中的柱状图
https://echarts.apache.org/examples/zh/editor.html?c=bar-simple
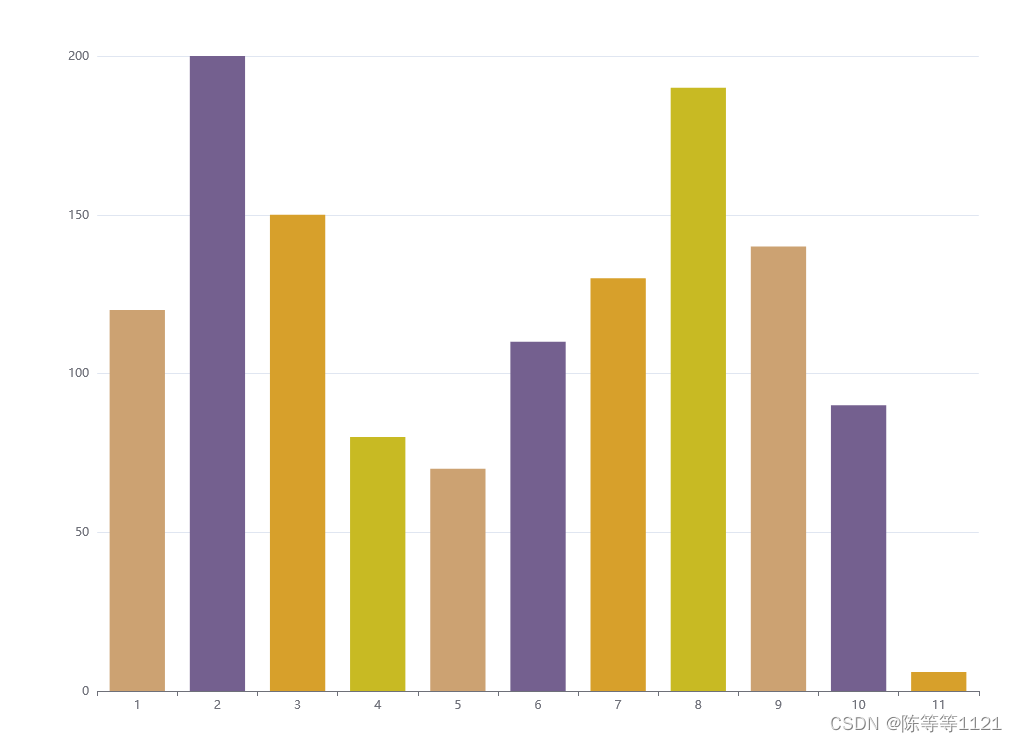
要每个柱子颜色不一样,当柱子数>颜色组数时循环调用颜色组数
效果图:
option = {
  xAxis: {
    type: 'category',
    data: ['1', '2', '3', '4', '5', '6', '7','8','9','10','11']
  },
  yAxis: {
    type: 'value'
  },
  series: [
    {
      data: [120, 200, 150, 80, 70, 110, 130,190,140,90,6],
      type: 'bar',
      itemStyle: {
						normal: {
							color: function(params) {
								// 给出颜色组
								var colorList = ['#cca272', '#74608f', '#d7a02b', '#c8ba23'];
                                //循环调用
								return colorList[params.dataIndex%colorList.length]
							},
						}
					},
    }
  ]
};版权声明:本文为chenfengdong原创文章,遵循CC 4.0 BY-SA版权协议,转载请附上原文出处链接和本声明。