bokeh pandas
Exploratory data analysis is the foundation for understanding and building effective ML models. Data visualization is a key part of EDA, and there are many tools available for this. Bokeh is an interactive visualization library. It provides intuitive and versatile graphics. Bokeh can help to quickly and easily make interactive plots and dashboards. Pandas Bokeh provides a Bokeh plotting backend for Pandas.
探索性数据分析是理解和构建有效ML模型的基础。 数据可视化是EDA的关键部分,为此可以使用许多工具。 Bokeh是一个交互式可视化库。 它提供直观,通用的图形。 散景可以帮助快速轻松地制作交互式绘图和仪表板。 Pandas Bokeh为Pandas提供了Bokeh绘图后端。
Integrating Pandas Bokeh with your Python code is very simple. You only need to install and import the pandas-bokeh library, and then you can use it like any other visual tool. You should import Pandas-Bokeh library after importing Pandas. Use the following command to download and import pandas-bokeh library:
将Pandas Bokeh与您的Python代码集成非常简单。 您只需要安装和导入pandas-bokeh库,然后就可以像使用其他任何可视工具一样使用它。 导入Pandas之后,您应该导入Pandas-Bokeh库。 使用以下命令下载和导入pandas-bokeh库:
#Load the pandas_bokeh library
!pip install pandas_bokehimport pandas as pd
import pandas_bokeh
You can set the plotting output as HTML or Notebook. To set the output to notebook use the command, pandas_bokeh.output_notebook(). This will embed the plot in the notebook cell. To display the output as a HTML file use the command, pandas_bokeh.output_file(filename).
您可以将绘图输出设置为HTML或Notebook。 要将输出设置为笔记本,请使用命令pandas_bokeh.output_notebook() 。 这将把情节嵌入笔记本单元中。 要将输出显示为HTML文件,请使用命令pandas_bokeh.output_file(filename) 。
You can easily plot Pandas DataFrames using the command, df.plot_bokeh(). Pandas Bokeh offers a wide variety of plotting options such as line, scatter, bar, histogram, area, mapplot, step, point, and pie. All the plots are interactive, pannable, and zoomable. Here are some examples with the code of popular visualizations, plotted using pandas_bokeh that are commonly used in data analysis.
您可以使用命令df.plot_bokeh()轻松绘制Pandas DataFrame。 熊猫散景提供多种绘图选项,例如线,散点图,条形图,直方图,面积,地图图,步骤,点和饼图。 所有地块都是交互式的,可平移的和可缩放的。 以下是一些流行的可视化代码的示例,这些示例是使用数据分析中常用的pandas_bokeh绘制的。
Bar Plot
条形图
#Vertical barchart
carhpbot.plot_bokeh(
    kind="bar",
    figsize =(1000,800),
    x="name",
    xlabel="Car Models",
    title="Bottom 10 Car Features",
    alpha=0.6,
    legend = "top_right",
    show_figure=True)#Stacked vertical bar
carhpbot.plot_bokeh.bar(
    figsize =(1000,800),
    x="name",
    stacked=True,
    xlabel="Car Models",
    title="Bottom 10 Car Features",
    alpha=0.6,
    legend = "top_right",
    show_figure=True)
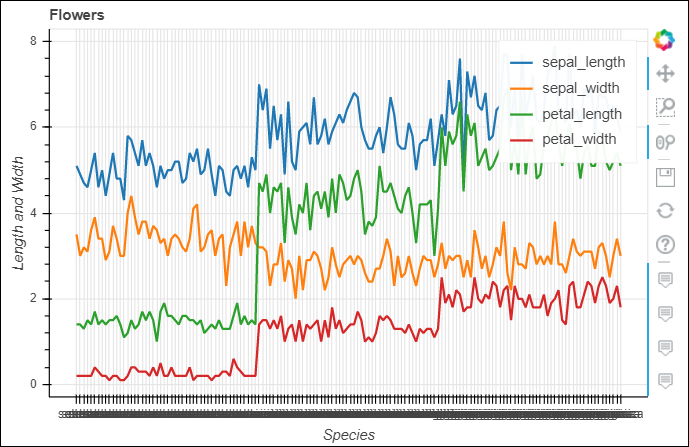
Line Plot
线图
iris.plot_bokeh(
    kind='line',
    x='species',
    y=['sepal_length', 'sepal_width','petal_length','petal_width'],
    xlabel='Species',
    ylabel='Length and Width',
    title='Flowers',
)
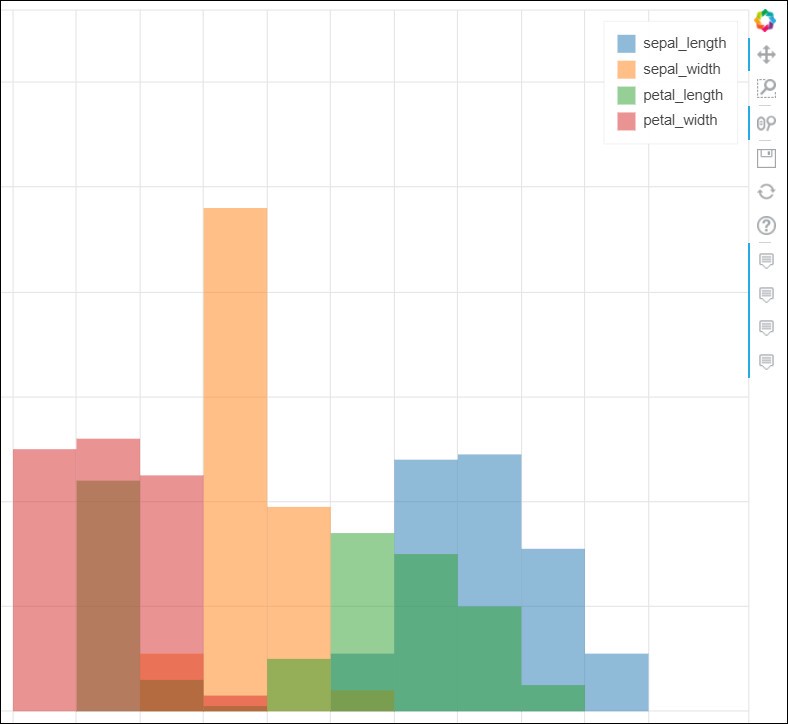
Histogram
直方图
iris.plot_bokeh(kind="hist",title ="Iris feature distribution",
                   figsize =(1000,800),
                   xlabel = "Features",
                   ylabel="Measure"
                )
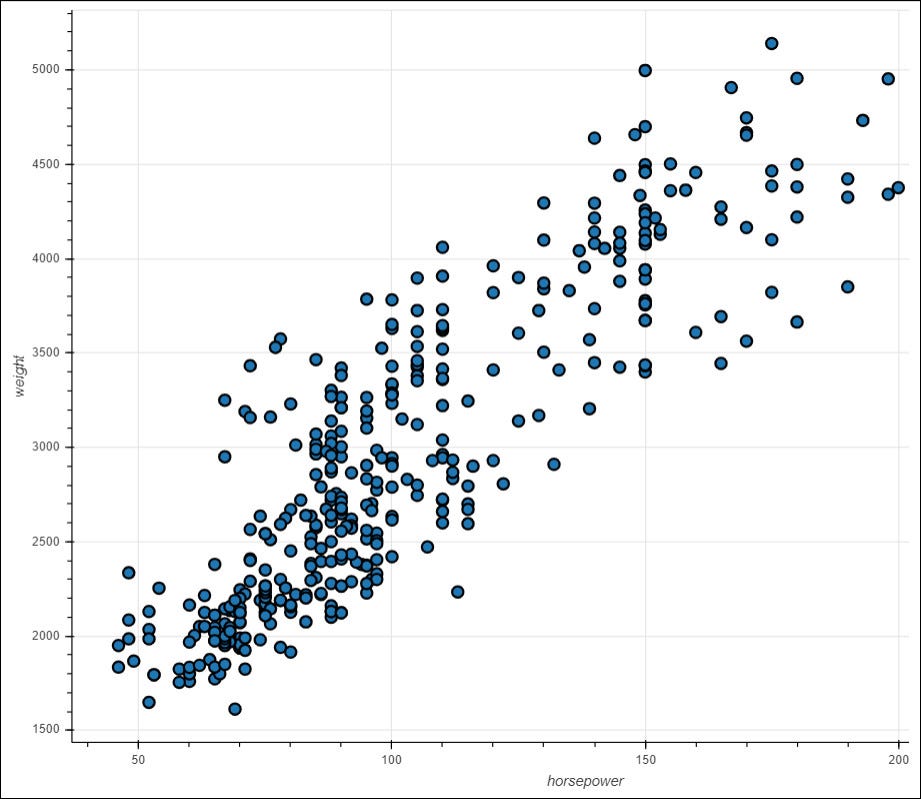
Scatter Plot
散点图
car.plot_bokeh.scatter(
    x='horsepower',
    y=['weight'],
    figsize=(1000, 700),
    zooming=False,
    panning=False
)
Map Plot
地图图
mapplot["size"] = mapplot["pop_max"] / 1000000
mapplot.plot_bokeh.map(
    x="longitude",
    y="latitude",
    hovertool_string="""<h2> @{name} </h2>

                        <h3> Population: @{pop_max} </h3>""",
    tile_provider="STAMEN_TERRAIN_RETINA",
    size="size",
    figsize=(1200, 600),
    title="Cities with more than 1000K population")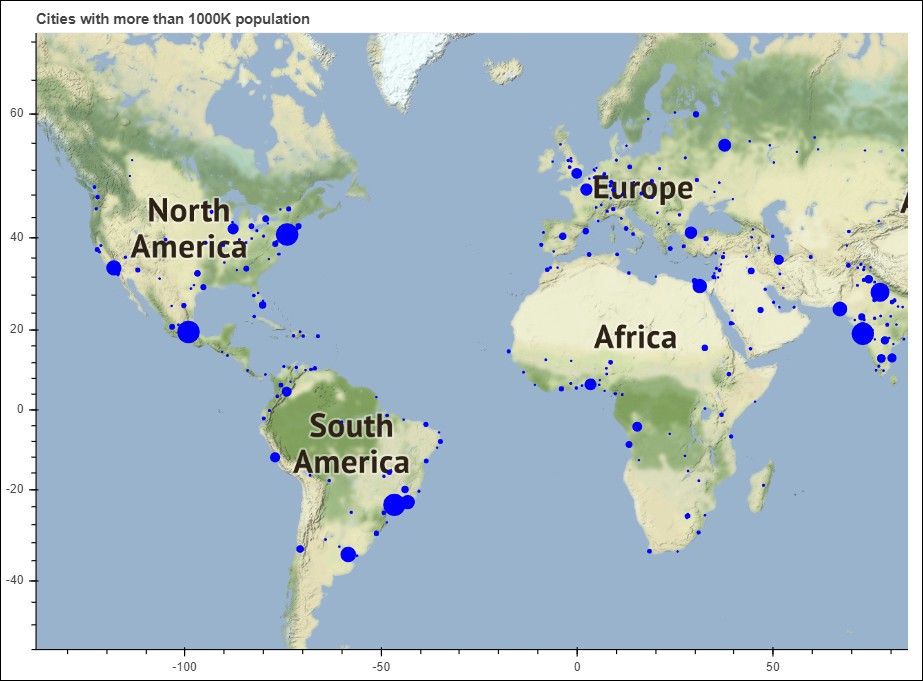
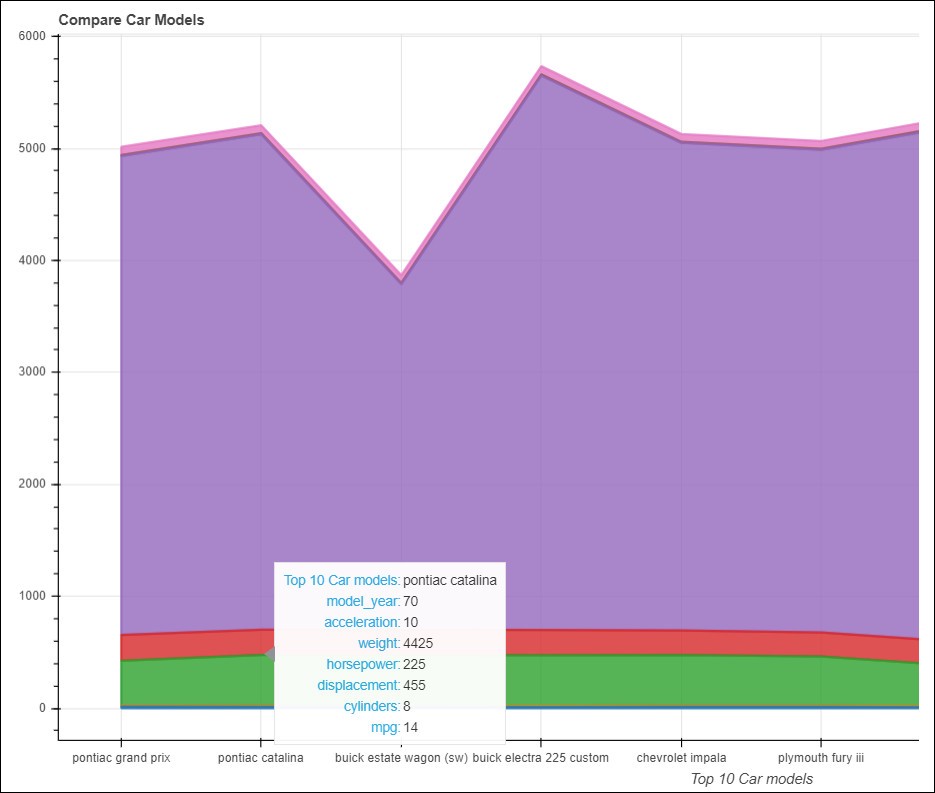
Area Plot
面积图
carhp.plot_bokeh.area(
    x="name",
    stacked=True,
    figsize=(1300, 700),
    title="Compare Car Models",
    xlabel="Top 10 Car models",
    )
These were some basic plots plotted using pandas_bokeh. Each of these plots can be enhanced further using various optional parameters. Pandas Bokeh has provided a wonderful GitHub repository explaining all the plots with some great examples. The examples that I have shown above are all available with the data set in my Kaggle notebook.
这些是使用pandas_bokeh绘制的一些基本图。 这些图的每一个都可以使用各种可选参数进一步增强。 Pandas Bokeh提供了一个很棒的GitHub存储库,并提供了一些出色的示例来解释所有情节。 我上面显示的示例都可以在Kaggle笔记本中使用数据集获得。
翻译自: https://towardsdatascience.com/data-visualization-using-pandas-bokeh-109240770fd3
bokeh pandas