数据预处理异常值处理
表中的内容(Table of Content)
- Definition of Outliers离群值的定义
- Different types of Outliers不同类型的离群值
- Ways to deal with Outliers处理离群值的方法
- Optional Content about SD & Variance关于SD和差异的可选内容
- Standard Deviation Method标准偏差法
- Interquartile Range Method(IQR)四分位距法(IQR)
- Automatic Outliers detection自动异常值检测
离群值的定义(Definition of Outliers)
An outlier is an unlikely observation in a dataset. It is rare, or distinct, or does not fit in some way.
离群值是数据集中不太可能观察到的。 它很少见或与众不同,或者在某种程度上不适合。
不同类型的离群值: (Different types of Outliers:)
Outliers can have many causes, such as:
离群值可能有多种原因,例如:
- Measurement or Manual error测量或手动错误
- Data generation flaw数据生成缺陷
- Data corruption资料损坏
- True outlier observation (E.g. Sachin tendulkar/Virat Kohli in Cricket)真正的异常值观察(例如,板球中的Sachin tentenkar / Virat Kohli)
There is no precise way to identify an outlier, domain expert needs to interpret the raw data and decide whethera value is an outlier or not.
没有精确的方法来识别异常值,领域专家需要解释原始数据并决定是否值是否为异常值。
处理离群值的方法 (Ways to deal with Outliers)
- Standard Deviation Method标准偏差法
- Interquartile Range Method (IQR)四分位间距法(IQR)
- Automatic Outlier Detection自动异常值检测
关于SD和差异的可选内容(Optional Content about SD& Variance)
Variance: In probability theory and statistics, variance is the expectation of the squared deviation of a random variable from its mean.Informally, it measures how far a set of numbers is spread out from their average value.
方差:在概率论和统计学中,方差是对随机变量与其均值平方差的期望,非正式地,它衡量一组数字与平均值之间的距离。
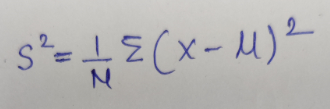
S² = sample varianceX = the value of the one observationμ = the mean value of all observationsN = the number of observations
S²=样本方差X =一次观测的值μ=所有观测的平均值N =观测数量
Standard Deviation: In statistics, the standard deviation is a measure of the amount of variation or dispersion of a set of values.A low standard deviation indicates that the values tend to be close to the mean of the set, while a high standard deviation indicates that the values are spread out over a wider range.
标准偏差:在统计中,标准偏差是对一组值的偏差或离散程度的度量。低标准偏差表示值倾向于接近该组平均值,而高标准偏差表示这些值分布在更大的范围内。
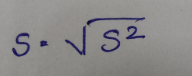
Variance (Sigma)² = average squared deviation of values from mean.Standard deviation (Sigma) = square root of the variance
方差(Sigma)² =值与平均值的平均平方偏差。 标准偏差(Sigma) =方差的平方根
As we square the deviations while calculating variance the unit changes E.g. lengths measured in metres(m) have a variance measured in metres squared (m²). Taking the square root of the variance gives us the units used in the original scale and this is the standard deviation.
当我们在计算方差时对偏差求平方时,单位变化的Eg长度以米(m)为单位,方差以米平方(m²)为单位。 取方差的平方根即可得出原始比例中使用的单位,这是标准偏差。
Standard deviation is a measures of spread around the mean. As it is closely linked with the mean, it is greatly affected by the outliers.
标准差是围绕均值分布的度量。 由于它与均值密切相关,因此受异常值的影响很大。
#当2个数据集具有相同或几乎相似的均值时? (# When 2 datasets have same or almost similar mean?)
SD is useful when comparing the spread of two separate data sets that have approximately the same mean. The data set with the smaller standard deviation has a narrower spread of measurements around the mean and therefore having comparatively fewer high or low values.
比较两个均值大致相同的独立数据集的散布时,SD很有用。 标准偏差较小的数据集在平均值附近的测量范围较窄,因此较高或较低的值相对较少。
But there are few considerations while checking the SD which have same mean.
但是,在检查SD时,没有太多考虑具有相同的意思。
Consider you are trying to compare two Cricket players having a difference of 3 centuries is pretty close but if we on the other hand compare the number of matches played has a difference of 30 then they are considered to be far apart. It is always useful to access the SD based on the mean value.
考虑到您正在尝试比较两个具有3个世纪差异的板球运动员,这非常接近,但是如果我们比较进行的比赛数具有30个差异,则认为他们相距甚远。 根据平均值访问SD总是有用的。
有关标准偏差和方差的重要事实 (Important facts about Standard deviation & Variance)
- Standard deviation:标准偏差:
- Standard deviation is never negative.标准偏差永远不会为负。
- Standard deviation is sensitive to outliers.标准差对异常值敏感。
2. Variance:
2.差异:
- Doubles the unit of measurement将测量单位加倍
- Variance is never negative.方差永远不会为负。
If all values of a data set are the same, the standard deviation is zero
如果数据集的所有值都相同,则标准偏差为零
When analyzing normally distributed data, standard deviation can be used in combination with the mean in order to calculate data intervals.
在分析正态分布的数据时,可以将标准差与平均值结合使用以计算数据间隔。
If x bar = mean, SD = standard deviation and x = a value in the data set, then
如果x bar =平均值,SD =标准偏差,x =数据集中的值,则
- 68% of the data lie in the interval: mean — SD < x < mean + SD68%的数据位于间隔中:均值-SD <x <均值+ SD
- 95% of the data lie in the interval: mean — 2SD< x <mean + 2SD95%的数据位于间隔中:均值-2SD <x <平均值+ 2SD
- 99% of the data lie in the interval: mean — 3SD < x < mean + 3SD99%的数据位于间隔中:均值— 3SD <x <均值+ 3SD

标准偏差法 (Standard Deviation Method)
If we know that the distribution of data we have follows a Normal distribution then we can use standard deviation method to handle outliers.Gaussian distribution is also commonly called the “normal distribution” and is often described as a “bell-shaped curve” is one of the methods to handle outliers.
如果我们知道数据的分布遵循正态分布,则可以使用标准差方法来处理离群值。 高斯分布通常也称为“正态分布”,通常被描述为“钟形曲线”,是处理离群值的方法之一。
The nature of the Gaussian gives a probability of 0.683 of being within one standard deviation of the mean i.e. within one standard deviation of the mean will cover 68% of the data.
高斯的性质给出0.683的概率在平均值的一个标准偏差内,即,在平均值的一个标准偏差内将覆盖68%的数据。
Consider, we have mean of 30 and the standard deviation is 4, then all data in the datasets between 26 and 34 will account for about 68% of the data sample. We can cover more of the data sample if we expand the range as follows:
考虑,我们的平均值为30,标准差为4,则数据集中26至34之间的所有数据将占数据样本的约68%。 如果我们扩大范围如下,我们可以涵盖更多的数据样本:
1 Standard Deviation from the Mean: 68%2 Standard Deviations from the Mean: 95%3 Standard Deviations from the Mean: 99.7%4 Standard Deviations from the Mean: 99.9%
1与均值的标准差:68%2与均值的标准差:95%3与均值的标准差:99.7%4与均值的标准差:99.9%
如何使用Python实现 (How to implement using Python)
# calculate mean & standard deviation
data_mean = np.mean(data)
data_std = np.std(data)
# identifying outliers
cut_off = data_std * 3 # We are considering 3SD away..please refer optional section if you have any doubts.
lower = data_mean — cut_off
upper = data_mean + cut_off
We can then identify outliers as those examples that fall outside of the defined lower and upper limits.
然后,我们可以将异常值标识为超出定义的上下限的那些示例。
outliers = [x for x in data if x < lower or x > upper]
actual_data = [x for x in data if x >= lower and x <= upper]
四分位间距法(IQR) (Interquartile Range Method (IQR))
All data points in real-world are not normally distributed. The interquartile range is a measure of where the “middle fifty” is in a data set.Where a range is a measure of where the beginning and end are in a set, an interquartile range is a measure of where the bulk of the values lie.
现实世界中的所有数据点都不是正态分布的。 四分位数范围是对数据集中“中间五十”位置的度量。四分位数范围是对数据集中开始和结束位置的度量,四分位数范围是对大部分值所在的度量。
In Simple words, the IQR is the first quartile subtracted from the third quartileFormulae :
用简单的话来说,IQR是从第三个四分位数公式中减去的第一个四分位数:
IQR = Q3 − Q1Where, Q3 is 75th percentile & Q1 is 25th percentile
IQR = Q3 − Q1其中,Q3为第75个百分位,而Q1为第25个百分位
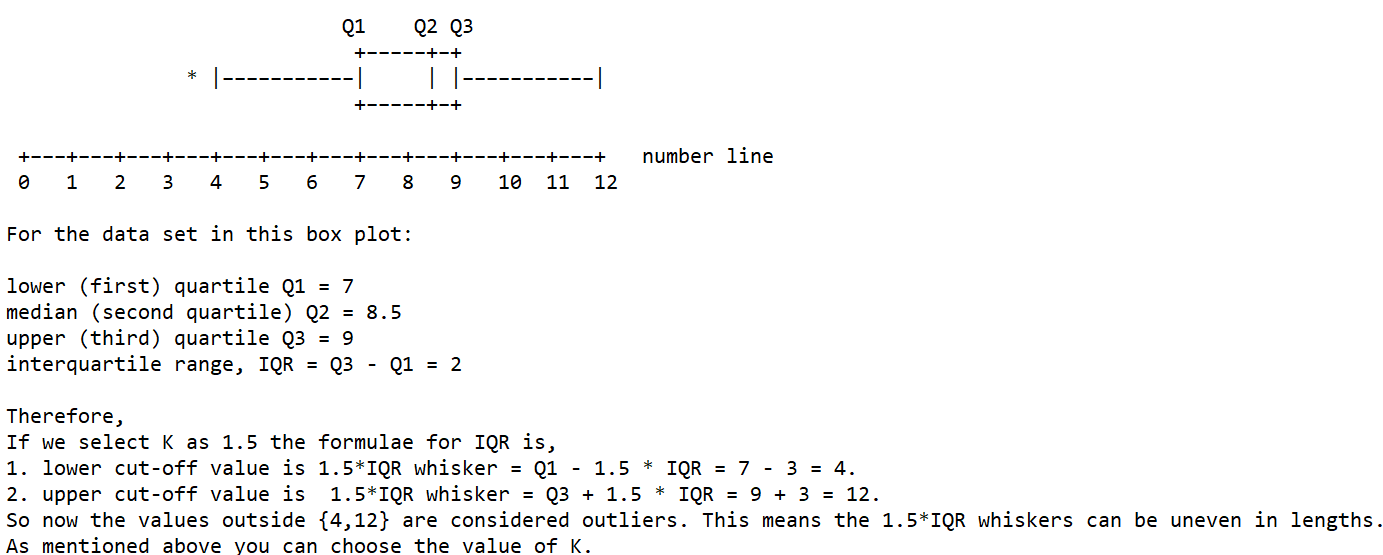
The IQR can be used to identify outliers by defining limits on the sample values that are a factor k of the IQR below the 25th percentile or above the 75th percentile.The common value for the factor k is the value 1.5.
通过定义样本值的限制,IQR可以用于识别异常值,这些样本值是IQR的因子k低于25%或高于75%百分数。因子k的通用值为1.5。
A factor k of 3 or more can be used to identify values that are extreme outliers or “far outs” when described in the context of box and whisker plots.On a box and whisker plot, these limits are drawn as fences on the whiskers (or the lines) that are drawn from the box. Values that fall outside of these values are drawn as dots
的因子k 3个或更多可被用于识别当盒的上下文和晶须plots.On一个盒须图描述是极端异常值或“远奏”,这些限制被绘制为在该晶须围栏值(或线条)。 超出这些值的值将被绘制为点
在Python中计算百分位数的方法?(Ways to calculate percentiles in python?)
- Describe function in python Dataframe.描述python Dataframe中的函数。
- Percentile function in numpy.numpy中的百分位数函数。
- Box / ViolenPlot.盒子/ ViolenPlot。
示例箱图数据集 (Example Box plot dataset)
如何使用笔和纸计算(How to calculate it using pen&paper)
# Put the numbers in order.
 1, 2, 5, 6, 7, 9, 12, 15, 18, 19, 27
# Find the median.
 1, 2, 5, 6, 7, 9, 12, 15, 18, 19, 27
# Place parentheses around the numbers above and below the median.
 (1, 2, 5, 6, 7), 9, (12, 15, 18, 19, 27)
# Find Q1 and Q3. Think of Q1 as a median in the lower half of the data and think of Q3 as a median for the upper half of data.
 (1, 2, 5, 6, 7), 9, ( 12, 15, 18, 19, 27). Q1 = 5 and Q3 = 18
# Subtract Q1 from Q3 to find the interquartile range.
 18–5 = 13.
What if I Have an Even Set of Numbers?
如果我有偶数集怎么办?
# Put the numbers in order.
 3, 5, 7, 8, 9, 11, 15, 16, 20, 21
# Make a mark in the center of the data.
 3, 5, 7, 8, 9, | 11, 15, 16, 20, 21
# Place parentheses around the numbers above and below the mark you made in Step 2–it makes Q1 and Q3 easier to spot.
 (3, 5, 7, 8, 9), | (11, 15, 16, 20, 21)
# Find Q1 and Q3
 (3, 5, 7, 8, 9), | (11, 15, 16, 20, 21). Q1 = 7 and Q3 = 16.
# Subtract Q1 from Q3.
 16–7 = 9
自动异常值检测 (Automatic Outlier Detection)

外部链接:(External Links:)
翻译自: https://medium.com/@dhirajmishra57/handling-outliers-in-datasets-3740b04b52a2
数据预处理异常值处理