目录
一 、简述:
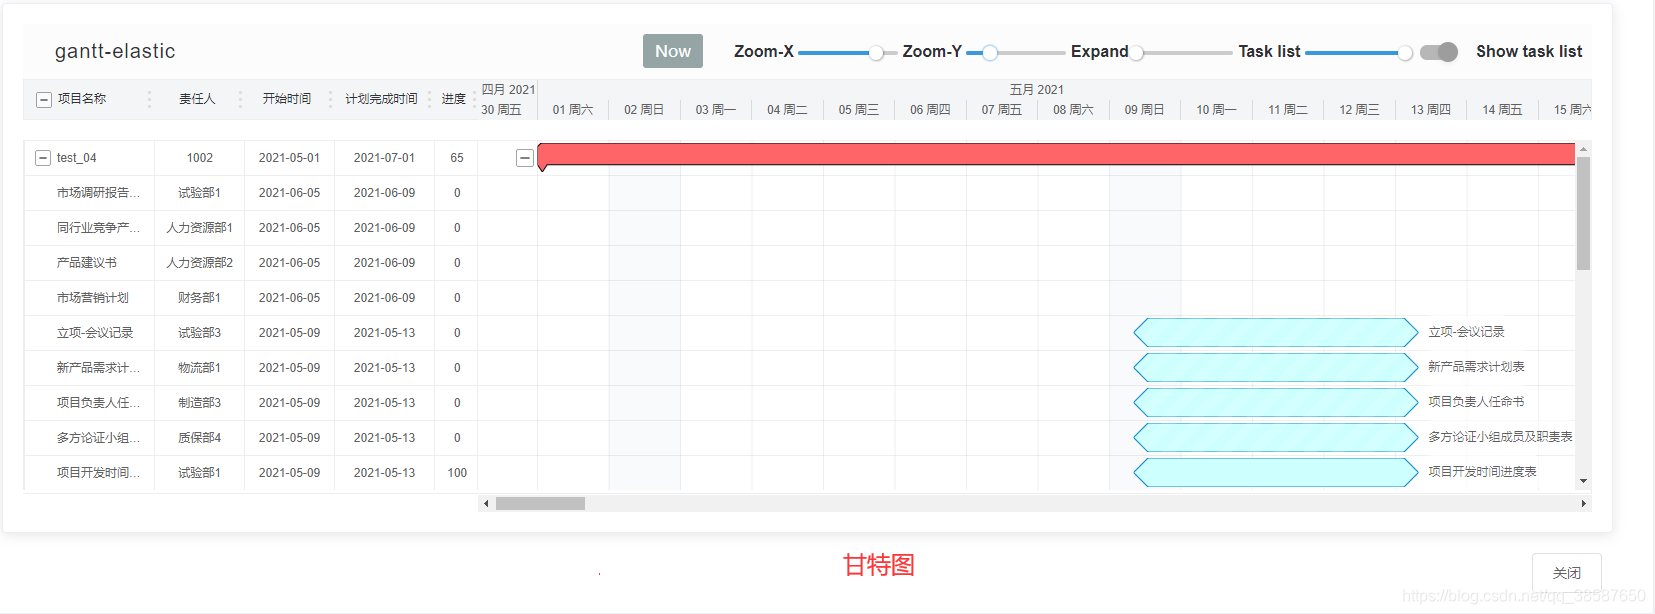
实验室横向课题项目中的一部分小内容,进行简短描述:Apqp项目立项后,Apqp执行阶段的5个阶段需要执行相应的任务。在项目查看模块可以查看到每个项目的进度、每个项目中各个部门具体参与的项目数等。Vue实现项目的可视化,借助Echarts实现,直接上图进行说明。
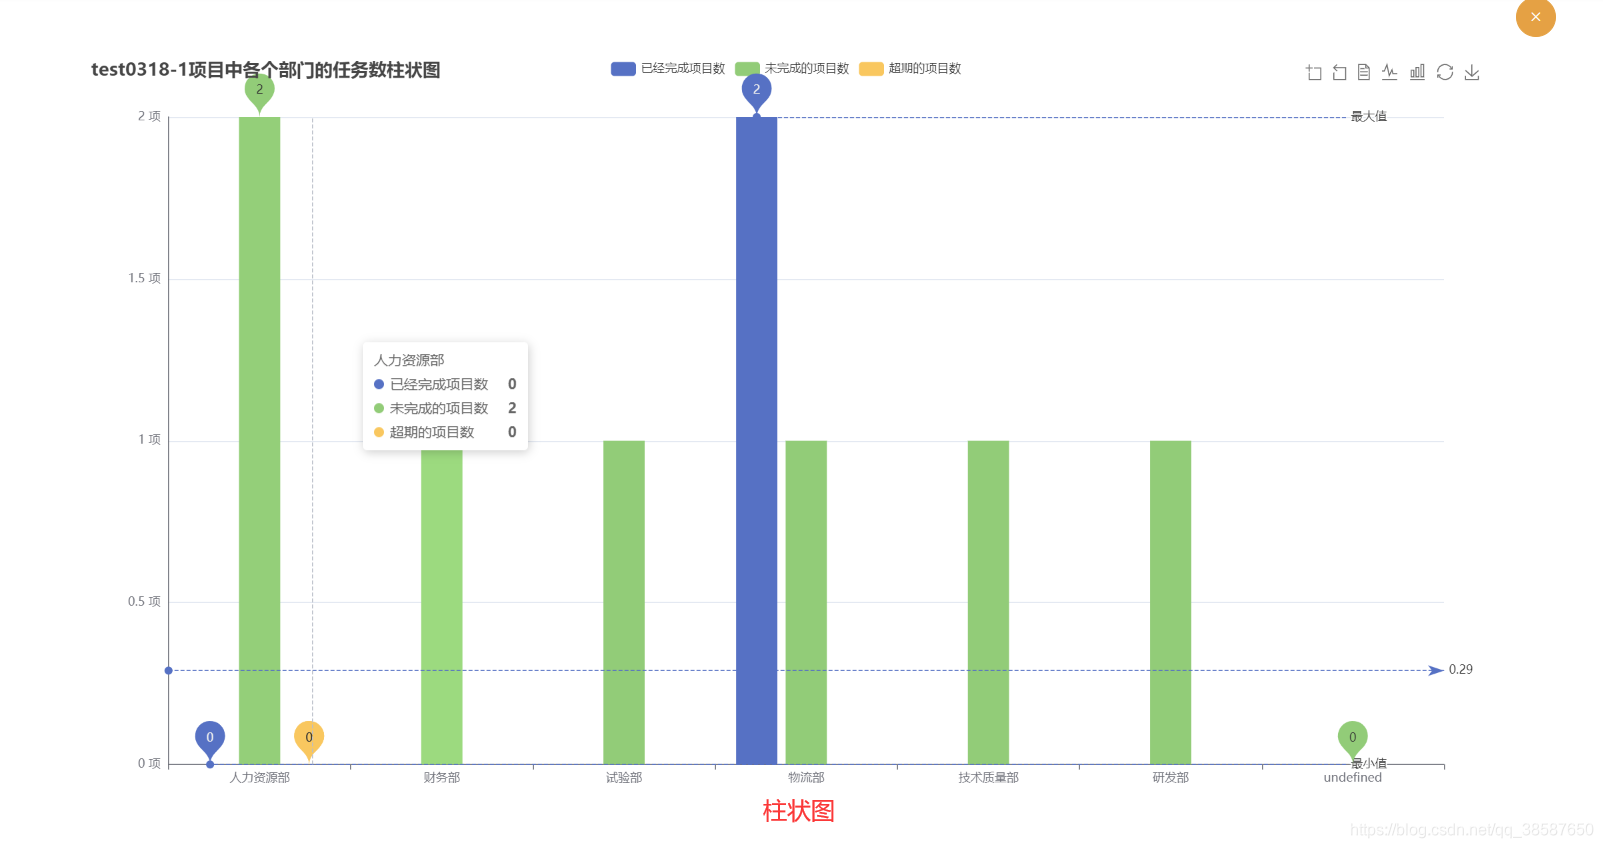
其中,柱状图和折线图的实现大致相同。
二、具体实现
2.1 甘特图
2.1.1 安装调用gantt-elastic组件
官网下载gantt-elastic组件: 链接直达
编译器输入以下命令:
npm install --save gantt-elastic
npm install --save gantt-elastic-header
2.1.2 具体的实现代码
<template>
  <el-card class="q-pa-sm">
    <div v-if="tasks.length > 0">
      <gantt-elastic
        :options="options"
        :tasks="tasks"
        @tasks-changed="tasksUpdate"
        @options-changed="optionsUpdate"
        @dynamic-style-changed="styleUpdate"
      >
        <!--
      甘特图的参数说明:
      options是配置设置
      tasks是左侧具体信息的设置
      @tasks-changed="tasksUpdate" tasksUpdate是甘特图中的数据发生变化时调用的方法
      @options-changed="optionsUpdate" optionsUpdate是opinions中的配置改变时的调用的
      @dynamic-style-changed="styleUpdate"  styleUpdate是样式发生改变时调用的
      -->
        <!--
        tasksUpdate 方法和 optionsUpdate 方法 在从后端接口中获取数据,赋值调用的同时,
        会出现死循环。所以要加上一个条件进行判断
       -->
        <gantt-header
          slot="header"
          class="gantt"
          :options="options"
        />
      </gantt-elastic>
      <!--任务详细信息模态框-->
      <el-dialog
        :title="taskName"
        width="870px"
        :visible.sync="taskInfoDialogFormVisible"
        :close-on-click-modal="false"
        @closed="reloadGantInfo"
      >
        <el-descriptions title="" direction="vertical" :column="4" border>
          <el-descriptions-item label="项目名">{{ taskName }}</el-descriptions-item>
          <el-descriptions-item label="负责人">{{ user }}</el-descriptions-item>
          <el-descriptions-item label="类型" :span="2">{{ type }}</el-descriptions-item>
          <el-descriptions-item label="时间跨度">{{ duration + "天" }}</el-descriptions-item>
          <el-descriptions-item label="是否完成">完成</el-descriptions-item>
        </el-descriptions>
      </el-dialog>
    </div>
  </el-card>
</template>

<style>
</style>

<script>
import GanttElastic from 'gantt-elastic'
import GanttHeader from 'gantt-elastic-header'
import dayjs from 'dayjs'


// just helper to get current dates
var vue_self = ''
function getVueSelf(data) {
  // 得到vue中this
  vue_self = data
}
const options = {
  taskMapping: {
    progress: 'percent'
  },
  maxRows: 100, // 设置最大行距
  maxHeight: 600, // 设置最大高度
  title: {
    label: 'Your project title as html (link or whatever...)',
    html: false
  },
  // 设置右侧甘特图的日期列宽
  times: {
    // 设置时间尺度timeZoom: 20,//设置右侧甘特图进度的列宽
    timeZoom: 18, // 设置甘特图进度的列宽
    timeScale: 60 * 1000// 设置时间尺度
  },
  scope: {
    before: 10,
    after: 10
  },
  // 设置行的样式
  row: {
    height: 24 // 设置行高
  },
  // 设置右侧甘特图的小时、天、月
  calendar: {
    workingDays: [1, 2, 3, 4, 5, 6], // 设置每周的时间
    gap: 20, // 与上方的距离
    strokeWidth: 5, // 距离下方的距离
    hour: {
      display: false // 设置小时是否出现
    }
  },
  // chart 设置右侧甘特图的样式
  chart: {
    progress: {
      bar: false
    },
    // expander设置收缩icon的样式属性
    expander: {
      type: 'chart',
      display: true,
      displayIfTaskListHidden: true, //*
      offset: 4, //*
      size: 18
    },
    grid: {
      horizontal: {
        gap: 3
      }
    },
    text: { // 设置文字的样式
      offset: 4, //*
      xPadding: 10, //*
      display: true //*
    }
  },

  taskList: {
    expander: {
      straight: false
    },
    columns: [
      {
        id: 1,
        label: 'ID',
        value: 'id',
        width: 40,
        style: {
          'task-list-header-label': {
            'text-align': 'center',
            width: '100%'
          },
          'task-list-item-value-container': {
            'text-align': 'center',
            width: '100%'
          }
        }
      },
      {
        id: 2,
        label: '名称',
        value: 'label',
        width: 180,
        expander: true,
        html: true,
        events: {
          click({ data }) {
            vue_self.taskInfoDialogFormVisible = true
            vue_self.taskId = data.id
            vue_self.taskName = data.label
            vue_self.user = data.user
            vue_self.type = data.type
            vue_self.duration = data.duration / (24 * 60 * 60 * 1000)
          }
        }
      },
      {
        id: 3,
        label: '负责人',
        value: 'user',
        width: 60,
        html: true,
        style: {
          'task-list-header-label': {
            'text-align': 'center',
            width: '100%'
          },
          'task-list-item-value-container': {
            'text-align': 'center',
            width: '100%'
          }
        }
      },
      {
        id: 3,
        label: '计划开始时间',
        value: (task) => dayjs(task.start).format('YYYY-MM-DD'),
        width: 100,
        style: {
          'task-list-header-label': {
            'text-align': 'center',
            width: '100%'
          },
          'task-list-item-value-container': {
            'text-align': 'center',
            width: '100%'
          }
        }
      },
      {
        id: 4,
        label: '计划结束时间',
        value: (task) => task.end === '无' ? task.end : dayjs(task.end).format('YYYY-MM-DD'),
        width: 100,
        style: {
          'task-list-header-label': {
            'text-align': 'center',
            width: '100%'
          },
          'task-list-item-value-container': {
            'text-align': 'center',
            width: '100%'
          }
        }
      },
      {
        id: 6,
        label: '实际开始时间',
        value: (task) => dayjs(task.real_start).format('YYYY-MM-DD'),
        width: 100,
        style: {
          'task-list-header-label': {
            'text-align': 'center',
            width: '100%'
          },
          'task-list-item-value-container': {
            'text-align': 'center',
            width: '100%'
          }
        }
      },
      {
        id: 7,
        label: '实际结束时间',
        value: (task) => task.real_end === '无' ? task.real_end : dayjs(task.real_end).format('YYYY-MM-DD'),
        width: 100,
        style: {
          'task-list-header-label': {
            'text-align': 'center',
            width: '100%'
          },
          'task-list-item-value-container': {
            'text-align': 'center',
            width: '100%'
          }
        }
      }
    ]
  },
  locale: {
    name: 'en',
    Now: '当前时间',
    'X-Scale': '宽',
    'Y-Scale': '高',
    'Task list width': '列头宽度',
    'Before/After': '时间跨度',
    'Display task list': '显示列头',
    weekdays: ['周日', '周一', '周二', '周三', '周四', '周五', '周六'],
    months: [
      '一月',
      '二月',
      '三月',
      '四月',
      '五月',
      '六月',
      '七月',
      '八月',
      '九月',
      '十月',
      '十一月',
      '十二月'
    ]
  }
}

export default {
  name: 'Gantt',
  // 调用两个组件
  components: {
    GanttElastic,
    GanttHeader
  },
  props: {
    value: {
      default: ''
    }
  },
  data() {
    return {
      // 任务详细信息模态框的显示
      taskInfoDialogFormVisible: false,
      options,
      dynamicStyle: {},
      lastId: 16,
      tasks: [],
      // 任务详细信息
      taskId: 1,
      taskName: '',
      taskStatus: '',
      user: '',
      type: '',
      duration: ''
    }
  },
  mounted() {
    this.getListData()
    getVueSelf(this)
  },
  methods: {
    async getListData() {
      var temp1 = {
        duration: this.value[0].duration * 24 * 60 * 60 * 1000,
        start: this.value[0].start,
        style: this.value[0].style,
        end: this.value[0].start + this.value[0].duration * 24 * 60 * 60 * 1000,
        label: this.value[0].label,
        id: this.value[0].id,
        type: this.value[0].type,
        user: this.value[0].user,
        percent: 10
      }
      this.tasks.push(temp1)
      for (var i = 1; i < this.value.length; i++) {
        if (this.value[i].real_start === 0) {
          this.value[i].real_start = (new Date()).valueOf()
        }
        if (this.value[i].real_end === 0) {
          this.value[i].real_end = (new Date()).valueOf()
        }
        const temp = {
          duration: this.value[i].duration * 24 * 60 * 60 * 1000,
          start: this.value[i].start,
          style: this.value[i].style,
          end: this.value[i].start + this.value[i].duration * 24 * 60 * 60 * 1000,
          label: this.value[i].label,
          id: this.value[i].id,
          type: this.value[i].type,
          user: this.value[i].user,
          percent: 0,
          real_start: this.value[i].real_start,
          real_end: this.value[i].real_end
        }
        this.tasks.push(temp)
      }
    },
    reloadGantInfo() {
      this.$emit('updateGantInfo')
    }
  }
}
</script>
<style scoped>
.gantt >>> .gantt-elastic__header-btn-recenter {
  font-size: 15px !important;
  background-color: #ffffff !important;
  color: #606266 !important;
  border: 1px solid #dcdfe6 !important;
  padding: 1px 10px !important;
}
.gantt >>> .gantt-elastic__header-btn-recenter:hover {
  background-color: #ecf5ff !important;
  border: 1px solid #b6d8fa !important;
}
.gantt >>> .gantt-elastic__header-title {
  display: none;
}
.gantt >>> .gantt-elastic__header-label {
  font-size: 16px;
  color: #303133;
}
.gantt >>> .gantt-elastic__header-task-list-switch--wrapper {
  font-size: 16px;
  color: #303133;
}
.gantt >>> .vue-switcher-theme--default.vue-switcher-color--default div {
  background-color: #409eff;
}
.gantt
>>> .vue-switcher-theme--default.vue-switcher-color--default.vue-switcher--unchecked
div {
  background-color: #dcdfe6;
}
.gantt >>> .vue-switcher-theme--default.vue-switcher-color--default div:after {
  background-color: #fff;
  box-shadow: 0.5px 0.5px 2px 1px rgba(0, 0, 0, 0.32);
}
</style>
后端返回的数据格式如下:
{
"success": true,
"message": "操作成功!",
"code": 200,
"result": [
{
"duration": 61,
"projectNo": "FD04-XM274-2021",
"start": 1619798400000,
"end": 0,
"style": {
"base": {
"fill": "#FF6666",
"stroke": "#000000"
}
},
"id": 0,
"label": "test_04",
"projectName": "test_04",
"type": "project",
"user": "1002",
"percent": 65
},
{
"duration": 4,
"start": 1622829600000,
"end": 0,
"style": {
"base": {
"fill": "#CCFFFF",
"stroke": "#0287D0"
}
},
"id": 1,
"label": "市场调研报告(包含市场测试、定位报告、市场调查表)",
"type": "milestone",
"user": "试验部1",
"percent": 0,
"parentId": 0
},
{
"duration": 4,
"start": 1622822400000,
"end": 0,
"style": {
"base": {
"fill": "#CCFFFF",
"stroke": "#0287D0"
}
},
"id": 2,
"label": "同行业竞争产品调查报告",
"type": "milestone",
"user": "人力资源部1",
"percent": 0,
"parentId": 0
},
{
"duration": 4,
"start": 1622822400000,
"end": 0,
"style": {
"base": {
"fill": "#CCFFFF",
"stroke": "#0287D0"
}
},
"id": 3,
"label": "产品建议书",
"type": "milestone",
"user": "人力资源部2",
"percent": 0,
"parentId": 0
},
{
"duration": 4,
"start": 1622822400000,
"end": 0,
"style": {
"base": {
"fill": "#CCFFFF",
"stroke": "#0287D0"
}
},
"id": 4,
"label": "市场营销计划",
"type": "milestone",
"user": "财务部1",
"percent": 0,
"parentId": 0
},
{
"duration": 4,
"start": 1620518580000,
"end": 0,
"style": {
"base": {
"fill": "#CCFFFF",
"stroke": "#0287D0"
}
},
"id": 5,
"label": "立项-会议记录",
"type": "milestone",
"user": "试验部3",
"percent": 0,
"parentId": 0
},
{
"duration": 4,
"start": 1620518580000,
"end": 0,
"style": {
"base": {
"fill": "#CCFFFF",
"stroke": "#0287D0"
}
},
"id": 6,
"label": "新产品需求计划表",
"type": "milestone",
"user": "物流部1",
"percent": 0,
"parentId": 0
},
{
"duration": 4,
"start": 1620518580000,
"end": 0,
"style": {
"base": {
"fill": "#CCFFFF",
"stroke": "#0287D0"
}
},
"id": 7,
"label": "项目负责人任命书",
"type": "milestone",
"user": "制造部3",
"percent": 0,
"parentId": 0
},
{
"duration": 4,
"start": 1620518580000,
"end": 0,
"style": {
"base": {
"fill": "#CCFFFF",
"stroke": "#0287D0"
}
},
"id": 8,
"label": "多方论证小组成员及职责表",
"type": "milestone",
"user": "质保部4",
"percent": 0,
"parentId": 0
},
{
"duration": 4,
"start": 1620518580000,
"end": 0,
"style": {
"base": {
"fill": "#CCFFFF",
"stroke": "#0287D0"
}
},
"id": 9,
"label": "项目开发时间进度表",
"type": "milestone",
"user": "试验部1",
"percent": 100,
"parentId": 0
},
{
"duration": 61,
"start": 1619798400000,
"end": 0,
"style": {
"base": {
"fill": "#CCFFFF",
"stroke": "#0287D0"
}
},
"id": 10,
"label": "概念提出/批准",
"type": "milestone",
"user": null,
"percent": 0,
"parentId": 0
}
],
"timestamp": 1624436284480
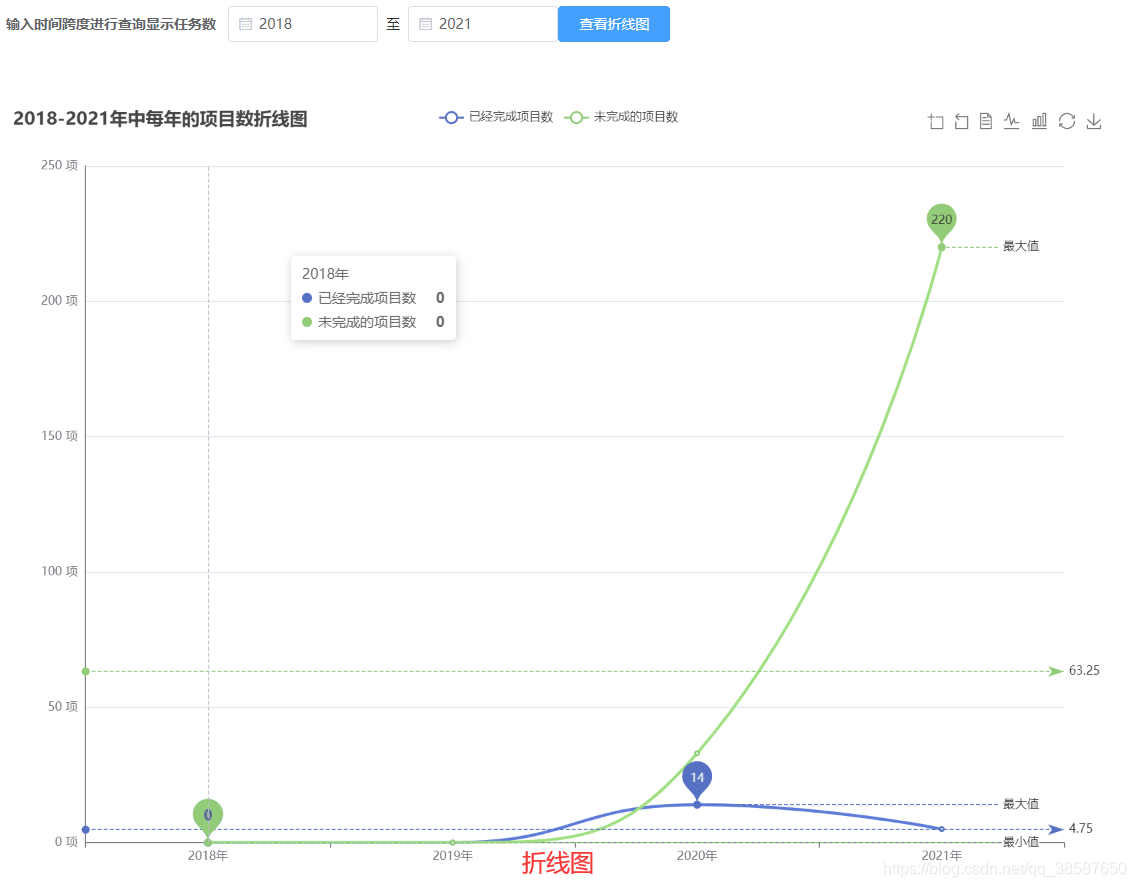
}2.2 折线图(柱状图与折线图实现原理大致相同)
<template>
  <div>
    <el-row>
      <el-col :span="20">
        <el-button type="warning" style="margin-left:110%" icon="el-icon-close" circle @click="closeZhuzhuang()" />
      </el-col>
    </el-row>
    <!-- 为echarts准备一个具备大小的容器dom-->
    <!-- ECharts 的工具栏组件在主要的图表功能之外,为用户提供了图片导出、数据视图切换、图表类型切换、数据区域缩放、还原、数据框选六类功能按钮。 -->
    <div id="main" class="line-wrap" style="margin-left:150px;margin-top:20px" :style="{width: '1400px', height: '750px'}" />
  </div>
</template>

<script>
import * as echarts from 'echarts'
export default {
  name: 'TaskCount',
  data() {
    return {
      projectName: '',
      projectNo: '',
      // 折线统计图参数
      charts: '',
      opinionDataFinish: [],
      opinionDataUnFinish: [],
      opinionOverdueProject: [],
      xData: [],
      deptIds: [],
      deptNames: [],
      currentYear: ''

    }
  },
  async created() {
    this.getPartionBydept()
    this.checkPartionBydept()
    const project = JSON.parse(this.$route.query.project)
    this.projectName = project.projectName
    const res = await this.$http.get('/dare/project/visualizationTask?projectNo=' + project.projectNo)
    this.xData = [] // 初始化让每一次刷新折线图就会清空列表
    this.opinionDataFinish = [] // 初始化让每一次刷新折线图就会清空列表
    this.opinionDataUnFinish = [] // 初始化让每一次刷新折线图就会清空列表
    this.opinionOverdueProject = [] // 初始化让每一次刷新折线图就会清空列表
    if (res.data.success === true && res.data.result != null) {
      if (res.data.result.length === 0) {
        this.$message('当前年份无项目!')
      } else {
        for (let i = 0; i < res.data.result.length; i++) {
          this.xData.push(this.checkPartionBydept(res.data.result[i].dept - 0))
          this.opinionDataFinish.push(res.data.result[i].finished)
          this.opinionDataUnFinish.push(res.data.result[i].unfinished)
          this.opinionOverdueProject.push(res.data.result[i].overTime)
        }
      }
      this.$nextTick(function() { // 调取折线图
        this.drawLine('main')
      })
    } else {
      this.$message.error(res.data.message)
    }
  },
  async mounted() {
    this.getPartionBydept()
    this.checkPartionBydept()
  },
  methods: {
    // 折现统计图方法
    drawLine(id) {
      this.charts = echarts.init(document.getElementById(id))
      this.charts.setOption({
        // 标题组件
        title: {
          text: this.projectName + '项目中各个部门的任务数柱状图' // 标题
        },
        // 提示框组件
        tooltip: {
          trigger: 'axis'// item数据项图形触发,axis坐标轴触发
        },
        // 图例组件,控制哪些系列不显示
        legend: {
          type: 'scroll', // scroll数量较多时可以使用滚动翻页的图例,默认'plain'普通图例
          top: '9%', // 距头部多远
          data: ['已经完成项目数', '未完成的项目数', '超期的项目数']// 头部数据
        },
        // 直角坐标系内绘图网格
        grid: {
          top: '10%', // grid组件距上下左右的距离
          left: '3%',
          right: '3%',
          bottom: '3%',
          containLabel: true, // grid区域是否包含坐标轴的刻度标签。
          width: 'auto',
          height: 'auto'
        },
        // 工具栏
        toolbox: {
          show: true,
          feature: { // 各工具配置项
            dataZoom: {
              yAxisIndex: 'none'
            },
            dataView: { readOnly: false },
            magicType: { type: ['line', 'bar'] },
            restore: {},
            saveAsImage: { pixelRatio: 1, type: 'jpeg', excludeComponents: ['legend'] }// 保存为图片
          }
          /**
           * 导出图片功能:
           * 工具栏组件的“图片导出”按钮可将图表导出为静态图片,支持 jpeg、png、svg 三种格式,可通过 saveAsImage 项进行配置,其中比较重要的配置项有:
           * type:用于设定导出图片的格式,当 renderer = canvas 时,支持 jpeg、png,默认为 png;当 renderer = svg 时仅支持 svg 格式;
           * name:导出的文件名,默认为配置项中的 title.text 值;
           * excludeComponents:导出时需要忽略的组件列表,默认值为 [‘toolbox’];
           * pixelRatio:导出图片的分辨率。
          */
        },
        // 直角坐标系 grid 中的 x 轴
        xAxis:
        [
          {
            type: 'category', // 坐标轴类型,category类目轴,适用于离散的类目数据
            boundaryGap: true, // 坐标轴两边留白策略,默认为 true
            axisTick: {
              show: true
            },
            data: this.xData, // 数据
            nameGap: 2, // 坐标轴名称与轴线之间的距离。
            // 坐标轴刻度标签的相关设置
            axisLabel: {
              interval: 0, // 横轴信息全部显示
              rotate: -45, // 倾斜度 -90 至 90 默认为0
              margin: 5, // 刻度标签与轴线之间的距离
              textStyle: {
                fontSize: 16, // 横轴字体大小
                color: '#000000' // 颜色
              }
            }

          }
        ],
        yAxis: [
          {
            type: 'value', // 'value' 数值轴,适用于连续数据
            axisTick: {
              show: false
            },
            axisLabel: {
              formatter: '{value} 项'
            },
            axisLine: {
              show: true
            }
          }
        ],

        series: [
          {
            name: '已经完成项目数', // 对应的系列
            type: 'bar',
            smooth: true,
            data: this.opinionDataFinish,
            markPoint: {
              data: [
                { type: 'max', name: '最大值' },
                { type: 'min', name: '最小值' }
              ]
            },
            markLine: {
              data: [
                { type: 'average', name: '平均值' },
                [{
                  symbol: 'none',
                  x: '90%',
                  yAxis: 'max'
                }, {
                  symbol: 'circle',
                  label: {
                    position: 'start',
                    formatter: '最大值'
                  },
                  type: 'max',
                  name: '最高点'
                }],
                [{
                  symbol: 'none',
                  x: '90%',
                  yAxis: 'min'
                }, {
                  symbol: 'circle',
                  label: {
                    position: 'start',
                    formatter: '最小值'
                  },
                  type: 'min',
                  name: '最小点'
                }]
              ]
            }
          },
          {
            name: '未完成的项目数',
            type: 'bar',
            smooth: true,
            data: this.opinionDataUnFinish,
            markPoint: {
              data: [
                { type: 'max', name: '最大值' },
                { type: 'min', name: '最小值' }
              ]
            },
            markLine: {
              data: [
                // { type: 'average', name: '平均值',
                //   label: {
                //     position: 'end'
                //   }},
                // [{
                //   symbol: 'none',
                //   x: '90%',
                //   yAxis: 'max'
                // }, {
                //   symbol: 'circle',
                //   label: {
                //     position: 'start',
                //     formatter: '最大值'
                //   },
                //   type: 'max',
                //   name: '最高点'
                // }]
                // [{
                //   symbol: 'none',
                //   x: '90%',
                //   yAxis: 'min'
                // }, {
                //   symbol: 'circle',
                //   label: {
                //     position: 'start',
                //     formatter: '最小值'
                //   },
                //   type: 'min',
                //   name: '最小点'
                // }]
              ]
            }
          },
          {
            name: '超期的项目数',
            type: 'bar',
            smooth: true,
            data: this.opinionOverdueProject,
            markPoint: {
              data: [
                { type: 'max', name: '最大值' },
                { type: 'min', name: '最小值' }
              ]
            }
          }
        ]
      })
    },
    // 按项目年份查询项目
    async getListByYear() {
      const res = await this.$http.get(
        '/dare/project/selectByYear?gmtCreated=' +
          this.form.proTime +
          '&state=' +
          this.form.state +
          '&pageNo=' +
          this.listQuery.page +
          '&pageSize=' +
          this.listQuery.limit
      )
      if (res.data.success === true && res.data.result != null) {
        if (res.data.result.length === 0) {
          this.$message('当前年份无项目!')
        } else {
        // 项目状态转换
          for (let i = 0; i < res.data.result.length; i++) {
            let state = res.data.result[i].proCompleteState // 项目的状态
            if (state === 0) {
              state = '进行中'
            } else if (state === 1) {
              state = '已完成'
            } else {
              state = '-'
            }
            res.data.result[i].proCompleteState = state
          }
        }
        this.list = res.data.result
        this.total = res.data.total
      }
    },
    //  根据部门号码查询部门名称
    async getPartionBydept() {
      const res = await this.$http.get('/dare/hrm/dept/listAll')
      if (res.data.success === true && res.data.result != null) {
        for (let i = 0; i < res.data.result.length; i++) {
          this.deptIds.push(res.data.result[i].deptId - 0)
          this.deptNames.push(res.data.result[i].deptName)
        }
      }
    },
    // 根据部门号判别部门
    checkPartionBydept(deptid) {
      for (let i = 0; i < this.deptIds.length; i++) {
        if (deptid === this.deptIds[i]) {
          return this.deptNames[i]
        }
      }
    },
    closeZhuzhuang() {
      this.$router.go('-1')
    }
  }
}
</script>

<style scoped>

</style>
后端返回的数据格式:
{
  "success": true,
  "message": "操作成功!",
  "code": 200,
  "result": [
    {
      "dept": "2",
      "unfinished": 3,
      "finished": 0,
      "overTime": 0
    },
    {
      "dept": "5",
      "unfinished": 1,
      "finished": 0,
      "overTime": 0
    }
  ],
  "timestamp": 1624436571986
}版权声明:本文为qq_38587650原创文章,遵循CC 4.0 BY-SA版权协议,转载请附上原文出处链接和本声明。