Spring Cloud Sleuth 性能测试
Spring Cloud Sleuth是Spring Cloud为分布式服务跟踪提供的解决方案。Spring Webflux是Spring 5.0添加的新功能,是一个典型非阻塞异步的框架,它的核心是基于Reactor的相关API实现的。本文只针对Spring Cloud Sleuth 在Spring webFlux与Spring webMVC模式下的性能测试。
本文基于的Spring环境:
spring-boot:2.0.2.RELEASE
spring-cloud:Finchley.RELEASE
我准备了三个必要的程序来做测试,分别是
1、eureka-server
提供eureka服务注册中心。
2、trace-a
微服务的调用方,通过访问"http://localhost:9801/trace-a"调用下面trace-b的服务,其中调用方式webMVC使用阻塞的RestTemplate,webFlux使用非阻塞的WebClient方式。
3、trace-b
微服务的生产者,对外提供 “http://localhost:9802/trace-b” 的地址来完成一个简单的请求。
webflux模式下使用sleuth
- pom.xml 中添加maven依赖配置
<dependencies>
<!--引入springboot -->
	<dependency>
		<groupId>org.springframework.boot</groupId>
		<artifactId>spring-boot-starter</artifactId>
	</dependency>
	<dependency>
		<groupId>org.springframework.cloud</groupId>
		<artifactId>spring-cloud-starter-netflix-eureka-client</artifactId>
	</dependency>
	<dependency>
		<groupId>org.springframework.boot</groupId>
		<artifactId>spring-boot-starter-webflux</artifactId>
	</dependency>
	<dependency>
		<groupId>org.springframework.cloud</groupId>
		<artifactId>spring-cloud-starter-sleuth</artifactId>
	</dependency>
</dependencies>
- 配置文件application.properties
trace-a和trace-b项目配置基本一样(除配置端口、应用名称)。
spring.application.name=trace-a
server.port=9801
#eureka
eureka.client.service-url.defaultZone=http://localhost:8111/eureka/
#取样率
spring.sleuth.sampler.probability=1.0
- 主要代码
首先创建一个配置类WebClientConfig,定义WebClient实例。如下:
import org.slf4j.Logger;
import org.slf4j.LoggerFactory;
import org.springframework.beans.factory.annotation.Autowired;
import org.springframework.cloud.client.loadbalancer.reactive.LoadBalancerExchangeFilterFunction;
import org.springframework.context.annotation.Bean;
import org.springframework.context.annotation.Configuration;
import org.springframework.web.reactive.function.client.WebClient;

@Configuration
public class WebClientConfig {
	@Autowired
	private LoadBalancerExchangeFilterFunction lbFunction;

	@Bean
    public WebClient webClient() {
        return WebClient.builder().filter(lbFunction).build();
    }
}
trace-a下创建一个service的实现SleuthService,利用webClient方式调用服务trace-b,如下:
import org.slf4j.Logger;
import org.slf4j.LoggerFactory;
import org.springframework.beans.factory.annotation.Autowired;
import org.springframework.stereotype.Service;
import org.springframework.web.reactive.function.client.WebClient;
import reactor.core.publisher.Mono;

@Service
public class SleuthService {
	private final Logger logger = LoggerFactory.getLogger(SleuthService.class);
	@Autowired
	WebClient webClient;

	public Mono<String> trace() {
		logger.info("===<call trace-b Service>===");
		return webClient.get()
                .uri("http://trace-b/trace-b")
                .retrieve()
                .bodyToMono(String.class);
	}
}
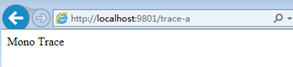
trace-b下的SleuthService返回“Mono Trace”文本信息,如下:
public Mono<String> trace() {
	return Mono.just("Mono Trace");
}
最后创建一个Restcontroller,里面定义一个http接口,做的事情是调用Service层的服务。
import org.springframework.beans.factory.annotation.Autowired;
import org.springframework.web.bind.annotation.RequestMapping;
import org.springframework.web.bind.annotation.RestController;
import ***.service.SleuthService;
import reactor.core.publisher.Mono;

@RestController
public class SleuthController {
	 @Autowired
	 private SleuthService sleuthService;

	 @RequestMapping("/trace-a")
	 public Mono<String> trace() {
		 return sleuthService.trace();
	 }
}
- 运行结果
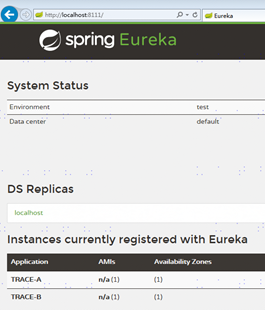
分别启动eureka-server,trace-a和trace-b服务 ,启动成功后在浏览器中输入“http://localhost:8111/” 显示在eureka注册中心中已经有两个服务注册了,如下图:
在浏览器中输入“http://localhost:9801/trace-a”, 请求trace-a服务,显示如下即成功返回:
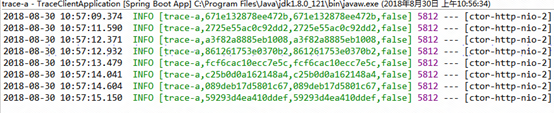
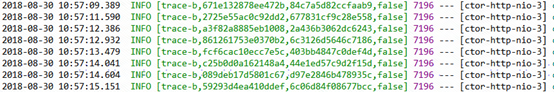
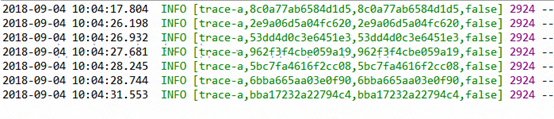
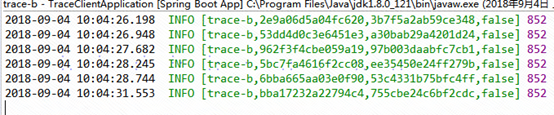
在trace-a和trace-b的console日志中均记录了各自的跟踪trace信息。
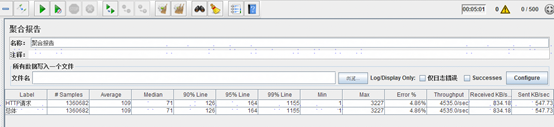
- Jmeter测试结果
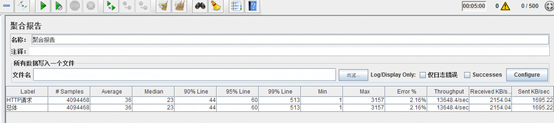
500并发,运行300s的结果如下,在压测一段时间后出现了一定比例的Error:
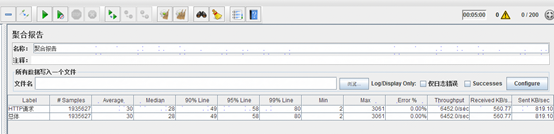
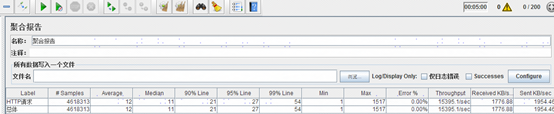
200并发,运行300s结果如下:
webflux模式下未使用sleuth
该案列和第一个案例除pom依赖和配置文件稍有差异外,其他代码均相同。
- pom.xml 中添加maven依赖配置
<dependencies>
	<!--引入springboot -->
	<dependency>
		<groupId>org.springframework.boot</groupId>
		<artifactId>spring-boot-starter</artifactId>
	</dependency>
	<dependency>
		<groupId>org.springframework.cloud</groupId>
		<artifactId>spring-cloud-starter-netflix-eureka-client</artifactId>
	</dependency>
	<dependency>
		<groupId>org.springframework.boot</groupId>
		<artifactId>spring-boot-starter-webflux</artifactId>
	</dependency>
</dependencies>
- 配置文件application.properties
去掉取样率的配置,trace-a和trace-b项目配置基本一样(除配置端口、应用名称)。
spring.application.name=trace-a
server.port=9801
#eureka
eureka.client.service-url.defaultZone=http://localhost:8111/eureka/
- 运行结果
trace-a和trace-b的日志中没有跟踪信息。
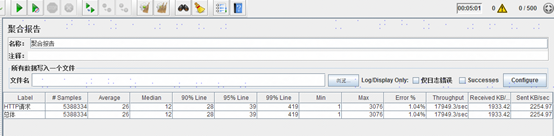
- Jmeter测试结果
500并发,运行300s的结果如下,在压测一段时间后出现了一定比例的Error:
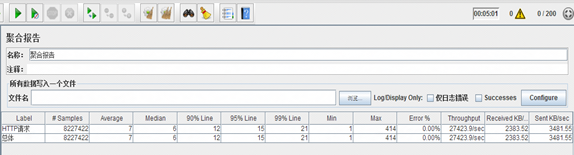
200并发,运行300s结果如下:
webMVC模式下使用sleuth
该案列和第一个案例除pom依赖和调用服务的代码稍有差异外,配置文件是相同。
- pom.xml 中添加maven依赖配置
<dependencies>
	<!--引入springboot -->
	<dependency>
		<groupId>org.springframework.boot</groupId>
		<artifactId>spring-boot-starter</artifactId>
	</dependency>
	<dependency>
		<groupId>org.springframework.cloud</groupId>
		<artifactId>spring-cloud-starter-netflix-eureka-client</artifactId>
	</dependency>
	<dependency>
		<groupId>org.springframework.boot</groupId>
		<artifactId>spring-boot-starter-web</artifactId>
	</dependency>
	<dependency>
		<groupId>org.springframework.cloud</groupId>
		<artifactId>spring-cloud-starter-sleuth</artifactId>
	</dependency>
</dependencies>
- 主要代码
创建一个Restcontroller,里面定义一个http接口,做的事情是调用Service层的服务。
import org.slf4j.Logger;
import org.slf4j.LoggerFactory;
import org.springframework.beans.factory.annotation.Autowired;
import org.springframework.web.bind.annotation.RequestMapping;
import org.springframework.web.bind.annotation.RequestMethod;
import org.springframework.web.bind.annotation.RestController;
import org.springframework.web.client.RestTemplate;

@RestController
public class SleuthController {
	@Bean
	@LoadBalanced
	RestTemplate restTemplate() {
		return new  RestTemplate();
	}
	@RequestMapping(value = "/trace-a", method = RequestMethod.GET)
	String trace() {
	logger.info("===<call trace-b>===");
	return restTemplate().getForEntity("http://trace-b/trace-b", String.class).getBody();
	}
}
- 运行结果
trace-a和trace-b的console日志中均记录了各自的跟踪trace信息。
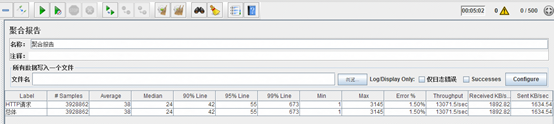
- Jmeter测试结果
500并发,运行300s的结果如下,在压测一段时间后出现了一定比例的Error:
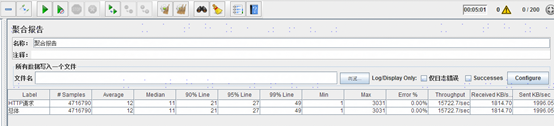
200并发,运行300s结果如下:
webMVC模式下未使用sleuth
该案列和第一个案例除pom依赖和配置文件稍有差异外,其他代码均相同。
- pom.xml 中添加maven依赖配置
<dependencies>
	<!--引入springboot -->
	<dependency>
		<groupId>org.springframework.boot</groupId>
		<artifactId>spring-boot-starter</artifactId>
	</dependency>
	<dependency>
		<groupId>org.springframework.cloud</groupId>
		<artifactId>spring-cloud-starter-netflix-eureka-client</artifactId>
	</dependency>
	<dependency>
		<groupId>org.springframework.boot</groupId>
		<artifactId>spring-boot-starter-web</artifactId>
	</dependency>
</dependencies>
- 配置文件application.properties
trace-a和trace-b项目配置基本一样(除配置端口、应用名称)。
spring.application.name=trace-a
server.port=9801
#eureka
eureka.client.service-url.defaultZone=http://localhost:8111/eureka/
- 运行结果
trace-a和trace-b的日志中没有跟踪信息。
- Jmeter测试结果
500并发,运行300s的结果如下,在压测一段时间后出现了一定比例的Error:
200并发,运行300s结果如下:
测试结果
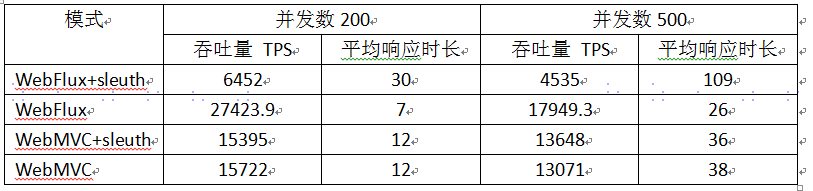
上述测试结果显示webFlux模式对提高系统吞吐量有明显作用,但是在webFlux模式下启用sleuth跟踪对系统性能影响很明显,相反地在WebMVC模式下启用sleuth跟踪对系统的性能影响很小。
以上内容为个人测试,仅供参考。若有问题请留言,谢谢。