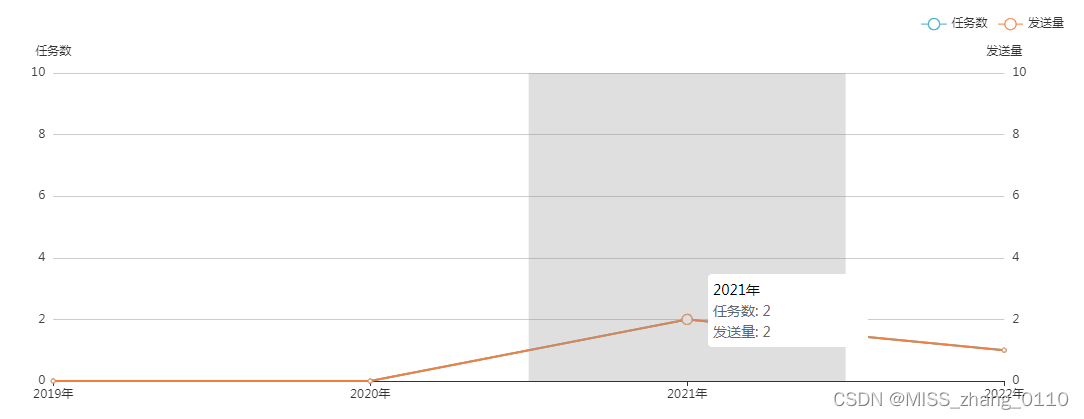
一、效果图
二、主要代码
 this.taskxAxis = []
 this.taskSeries = [[], []]

taskInit() {
     function calMax(arr) {
         var max = arr[0]
         for (var i = 1; i < arr.length; i++) {
             // 求出一组数组中的最大值
             if (max < arr[i]) {
                 max = arr[i]
             }
         }
         var maxint = Math.ceil(max / 10) // 向上取整
         var maxval = maxint * 10 // 最终设置的最大值
         return maxval // 输出最大值
     }
     var maxappreg = calMax(this.taskSeries[0]) //任务数值
     var maxactive = calMax(this.taskSeries[1]) //发送量值
     var interval_left = maxappreg / 5 //左轴间隔
     var interval_right = maxactive / 5 //右轴间隔

     this.taskEchartLine = echarts.init(this.$refs['taskLineChart'])
     window.addEventListener('resize', () => {
         this.taskEchartLine && this.taskEchartLine.resize()
     })
     this.taskOption = {
         tooltip: {
             trigger: 'axis',
             backgroundColor: '#fff', // 提示框背景
             formatter: params => {
                 return `
                 <div style="border:0;color:#666;text-align: left;width:150px">
                   <p style="color:#000"> ${params[0].axisValue}</p>
                     <div class="flex justify-content-space-between">
                         <div>
                             <span> 任务数:
                             ${(function () {
                                 if (params[0].data >= 10000) {
                                     return params[0].data / 10000 + '万'
                                 } else if (params[0].data < 10000) {
                                     return params[0].data
                                 }
                             })()}
                             </span>
                         </div>
                     </div>
                     <div class="flex justify-content-space-between">
                         <div>
                             <span> 发送量:
                             ${(function () {
                                 if (params[1].data >= 10000) {
                                     return params[1].data / 10000 + '万'
                                 } else if (params[1].data < 10000) {
                                     return params[1].data
                                 }
                             })()}
                             </span>
                         </div>
                     </div>
                   </div> `
             },
             axisPointer: {
                 type: 'shadow',
             },
         },
         color: ['rgb(65,169,203)', 'rgb(246,126,60)'],
         legend: {
             data: ['任务数', '发送量'],
             left: 'right',
             selectedMode: false, //取消图例上的点击事件
         },
         grid: {
             left: '3%',
             right: '4%',
             bottom: '3%',
             containLabel: true,
         },
         xAxis: {
             type: 'category',
             boundaryGap: false,
             data: this.taskxAxis,
         },
         yAxis: [
             {
                 type: 'value',
                 name: '任务数',
                 min: 0,
                 max: maxappreg,
                 splitNumber: 5,
                 interval: interval_left,
                 axisLine: {
                     //y轴
                     show: false,
                 },
                 axisTick: {
                     //y轴刻度线
                     show: false,
                 },
                 axisLabel: {
                     color: '#444343',
                     formatter: function (value, index) {
                         var value
                         if (value >= 10000) {
                             value = value / 10000 + '万'
                         } else if (value < 10000) {
                             value = value
                         }
                         return value
                     },
                 },
             },
             {
                 type: 'value',
                 name: '发送量',
                 min: 0,
                 max: maxactive,
                 splitNumber: 5,
                 interval: interval_right,
                 axisLine: {
                     //y轴
                     show: false,
                 },
                 axisTick: {
                     //y轴刻度线
                     show: false,
                 },
                 axisLabel: {
                     color: '#444343',
                     formatter: function (value, index) {
                         var value
                         if (value >= 10000) {
                             value = value / 10000 + '万'
                         } else if (value < 10000) {
                             value = value
                         }
                         return value
                     },
                 },
             },
         ],
         series: [
             {
                 name: '任务数',
                 type: 'line',
                 data: this.taskSeries[0],
             },
             {
                 name: '发送量',
                 type: 'line',
                 yAxisIndex: 1, //在单个图表实例中存在多个y轴的时候有用
                 data: this.taskSeries[1],
             },
         ],
     }
     this.taskEchartLine.setOption(this.taskOption)
 },
版权声明:本文为MISS_zhang_0110原创文章,遵循CC 4.0 BY-SA版权协议,转载请附上原文出处链接和本声明。