最近做可视化比较多,就常用的图表类型做了一下总结。
因为做可视化的图表代码量非常大,所以会把echarts图表单独抽离出来,封装成一个组件,也可以复用,所以这里我直接把封装的组件直接放在这里,是可以直接拿来用的,根据所需稍作修改即可。
这里都是用的vue3,其实和vue2差不多,各式各样的花里胡哨的图表无非就是option配置不同,如果使用的是vue2,在写法上稍作修改即可。
上篇博客有写 echarts 图表组件封装模板,vue2、vue3都有可以参考,链接附上echarts图表组件封装模板
1.渐变色柱状图

<template>
  <div :id="id" style="width: 100%; height: 100%"></div>
</template>
<script setup>
import { fontChart } from '@/utils/echartPxToRem'
import * as echarts from "echarts";
import { onMounted, watch, onUnmounted } from "vue";

const props = defineProps({
  id: {
    type: String,
    required: true,
  },
  xValue: {
    type: Array,
    default: () => ['区域1', '区域2', '区域3', '区域4', '区域5'],
  },
  yValue: {
    type: Array,
    default: () => [4,2,3,4,5],
  },
  yname: {
    type: String,
    default: "人",
  },
  rotate: {
    type: Number,
    default: 0,
  },
  offsetX: {
    type: Number,
    default: 0,
  },
});

watch(
  () => props.yValue,
  (newValue) => {
    drawBar()
  },
  {
    deep: true
  }
)

let charts = "";  // 这里不要让它成为响应式

onMounted(() => {
  drawBar();
});

onUnmounted(() => {
  window.removeEventListener('resize', selfAdaption)
})
//  初始化echarts
const drawBar = () => {
  charts = echarts.init(document.getElementById(props.id));
  let option = {
    tooltip: {
      trigger: "axis",
      axisPointer: {
        // 坐标轴指示器,坐标轴触发有效
        type: "shadow", // 默认为直线,可选为:'line' | 'shadow'
      },
    },
    legend: {
      show: false,
      data: ["违章指挥"],
      textStyle: {
        fontSize: fontChart(12),
        color: "#7e8390",
      },
      // itemStyle: {
      //   borderType: 'dashed',
      //   borderColor: '#0182d6',
      //   borderWidth: 1
      // }
    },
    grid: {
      left: "3%",
      right: "10%",
      bottom: "5%",
      top: "12%",
      containLabel: true,
    },
    xAxis: {
      type: "category",
      name: "(区域)",
      nameTextStyle: {
        color: "rgba(255, 255, 255, 0.8)",
        verticalAlign: "top",
        fontSize: fontChart(13),
      },
      offset: fontChart(props.offsetX),
      data: props.xValue,
      axisTick: {
        show: false,
        alignWithLabel: true,
      },
      axisLine: {
        lineStyle: {
          color: "#0f5681",
        },
      },
      axisLabel: {
        show: true,
        interval: 0,
        rotate: fontChart(props.rotate),
        align: "center",
        textStyle: {
          color: "rgba(255, 255, 255, 0.8)", //更改坐标轴文字颜色
          fontSize: fontChart(14), //更改坐标轴文字大小
        },
      },
    },
    yAxis: {
      type: "value",
      name: "(" + props.yname + ")",
      nameTextStyle: {
        color: "rgba(255, 255, 255, 0.8)",
        fontSize: fontChart(13),
        align: "right",
      },
      axisLabel: {
        show: true,
        align: "center",
        textStyle: {
          color: "rgba(255, 255, 255, 0.8)", //更改坐标轴文字颜色
          fontSize: fontChart(14), //更改坐标轴文字大小
        },
      },
      splitLine: {
        lineStyle: {
          color: "#0f5681",
          type: "dotted",
        },
      },
    },
    series: [
      {
        // name: '违章指挥',
        type: "bar",
        barWidth: "30%",
        label: {
          show: true,
          position: "top",
        },
        itemStyle: {
          normal: {
            label: {
              show: true, //是否显示
              position: "top", //显示位置
              textStyle: {
                color: "#fff",
                fontSize: fontChart(13),
              },
              formatter: (params) => {
                //核心部分 formatter 可以为字符串也可以是回调
                if (params.value) {
                  //如果当前值存在则拼接
                  // console.log(params,'echarts---->')
                  // return params.value + '/' //拼接上限
                  return params.value; //拼接上限
                } else {
                  //否则返回个空
                  return "";
                }
              },
            },
            color: new echarts.graphic.LinearGradient(0, 0, 0, 1, [
              { offset: 0, color: "#32befe" },
              { offset: 1, color: "#016cf4" },
            ]),
          },
        },
        // itemStyle: {
        //   color: 'transparent',  // 全透明
        //   borderType: 'dashed',  //  虚线
        //   borderColor: '#0182d6'
        // },
        emphasis: {
          color: new echarts.graphic.LinearGradient(0, 0, 0, 1, [
            { offset: 0, color: "#32befe" },
            { offset: 1, color: "#016cf4" },
          ]),
        },
        data: props.yValue,
      }
    ]
  }
  charts.setOption(option)
  window.addEventListener('resize', selfAdaption)
};

//  自适应
function selfAdaption() {
  if(!charts) return
  charts.resize()
  drawBar()
}
</script>
2. 堆叠柱状图

<template>
  <div :id="id" style="width: 100%; height: 100%"></div>
</template>
<script setup>
import { fontChart } from '@/utils/echartPxToRem'
import * as echarts from "echarts";
import { onMounted, watch, onUnmounted } from "vue";

const props = defineProps({
  id: {
    type: String,
    required: true,
  },
  colorList: {
    type: Array,
    default: () => ['#1760bc', '#029bff', '#fac800', '#a7f901', '#06c8cd', '#ee7604']
  },
  xValue: {
    type: Array,
    default: () => ['2021-09-15', '2021-09-16', '2021-09-17', '2021-09-18', '2021-09-19', '2021-09-20', '2021-09-21']
  },
  yValue1: {
    type: Array,
    default: () => [320, 332, 301, 334, 390, 330, 320]
  },
  yValue2: {
    type: Array,
    default: () => [120, 132, 101, 134, 90, 230, 210]
  },
  yValue3: {
    type: Array,
    default: () => [220, 182, 191, 234, 290, 330, 310]
  },
  yValue4: {
    type: Array,
    default: () => [150, 232, 201, 154, 190, 330, 410]
  },
  yValue5: {
    type: Array,
    default: () => [862, 1018, 964, 1026, 1679, 1600, 1570]
  },
  yValue6: {
    type: Array,
    default: () => [30, 50, 40, 60, 80, 70, 40]
  }
});

watch(
  () => props.yValue6,
  (newValue) => {
    drawStack()
  },
  {
    deep: true
  }
)

let charts = "";  // 这里不要让它成为响应式

onMounted(() => {
  drawStack();
});

onUnmounted(() => {
  window.removeEventListener('resize', selfAdaption)
})
//  初始化echarts
const drawStack = () => {
  charts = echarts.init(document.getElementById(props.id));
  let option = {
    tooltip: {
      trigger: 'axis',
      axisPointer: {
        type: 'shadow'
      }
    },
    color: props.colorList,
    legend: {
      // icon:'rect',  //'circle', 'rect', 'roundRect', 'triangle', 'diamond', 'pin', 'arrow', 'none'
      // data: [],
      itemWidth: fontChart(25),   //修改图例宽度
      itemHeight: fontChart(12),	//修改图例高度
      itemGao: fontChart(12), //设置图例间距
      textStyle: {
        color: '#898d99',
        fontSize: fontChart(12)
      }
    },
    grid: {
      left: '3%',
      right: '4%',
      bottom: '5%',
      top: '28%',
      containLabel: true
    },
    xAxis: {
      type: 'category',
      offset:fontChart(0),//x轴文字距离x轴的偏移量
      data: props.xValue,
      axisLabel: {
        textStyle: {
          fontSize: fontChart(13)
        }
      }
    },
    yAxis: [
      {  //左边y轴
        type: 'value',
        name: '(m³/min)', //单位
        nameTextStyle: {
          color: 'rgba(255, 255, 255, 0.8)',
          fontSize:fontChart(13),
          align: 'right'
        },
        axisLabel: {
          show: true,
          textStyle: {
            color: '#7e8390',  //更改坐标轴文字颜色
            fontSize: fontChart(14)      //更改坐标轴文字大小
          }
        },
        splitLine: {
          lineStyle: {
            color: '#0f5681',
            type: 'dotted'
          }
        },
      },
      { //右边y轴
        type: 'value',
        name: '(%)',//单位
        nameTextStyle: {
          color: 'rgba(255, 255, 255, 0.8)',
          fontSize:fontChart(13),
          align: 'left'
        },
        min: 0,
        max: 100,
        axisLabel: {
          show: true,
          textStyle: {
            color: '#7e8390',  //更改坐标轴文字颜色
            fontSize: fontChart(14),      //更改坐标轴文字大小
            align:'center'
          }
        },
        splitLine: {
          show: false,
          lineStyle: {
            color: '#0f5681',
            type: 'dotted'
          }
        },
      }
    ],
    dataZoom: {
      show: true,
      realtime: true,
      // y: 'bottom',
      bottom: 10,
      height: 5,
      start: 0,
      end: 80,
      backgroundColor: '#383f52',
      // handleSize:0,
      handleStyle: {
        borderColor: "#cacaca",
        borderWidth: "1",
        shadowBlur: 2,
        background: "#7f8390",
        shadowColor: "#7f8390",
      },
    },
    series: [
      {
        name: '塔里风排瓦斯量',
        type: 'bar',
        stack: 'Ad',
        emphasis: {
          focus: 'series'
        },
        label: {  //柱子顶部是否显示数值
          show:false,
          position: 'top',
          textStyle: {
            color:'#fff',
            fontSize:fontChart(13)
          }
        },
        data: props.yValue1
      },
      {
        name: '上寺头风排瓦斯量',
        type: 'bar',
        stack: 'Ad',
        emphasis: {
          focus: 'series'
        },
        label: {
          show:false,
          position: 'top',
          textStyle: {
            color:'#fff',
            fontSize:fontChart(13)
          }
        },
        data: props.yValue2
      },
      {
        name: '塔里瓦斯抽放量',
        type: 'bar',
        stack: 'ws',
        emphasis: {
          focus: 'series'
        },
        label: {
          show:false,
          position: 'top',
          textStyle: {
            color:'#fff',
            fontSize:fontChart(13)
          }
        },
        data: props.yValue3
      },
      {
        name: '上寺头瓦斯抽放量',
        type: 'bar',
        stack: 'ws',
        emphasis: {
          focus: 'series'
        },
        label: {
          show:false,
          position: 'top',
          textStyle: {
            color:'#fff',
            fontSize:fontChart(13)
          }
        },
        data: props.yValue4
      },
      {
        name: '全矿绝对瓦斯涌出量',
        type: 'bar',
        data: props.yValue5,
        emphasis: {
          focus: 'series'
        },
        label: {
          show:false,
          position: 'top',
          textStyle: {
            color:'#fff',
            fontSize:fontChart(13)
          }
        },
        // markLine: {
        //   lineStyle: {
        //     type: 'dashed'
        //   },
        //   data: [[{ type: 'min' }, { type: 'max' }]]
        // }
      },
      {
        name: '抽采率',
        type: 'line',
        yAxisIndex: 1,
        emphasis: {
          focus: 'series'
        },
        label: {
          show:false,
          position: 'top',
          textStyle: {
            color:'#fff',
            fontSize:fontChart(13)
          }
        },
        data: props.yValue6
      },
    ]
  }
  charts.setOption(option)
  window.addEventListener('resize', selfAdaption)
};

//  自适应
function selfAdaption() {
  if(!charts) return
  charts.resize()
  drawStack()
}
</script>
3. 带有标记线柱状图

<template>
<div :id="id" style="width: 100%; height: 100%"></div>
</template>
<script setup>
import { fontChart } from "@/utils/echartPxToRem";
import * as echarts from "echarts";
import { onMounted, watch, onUnmounted } from "vue";
const props = defineProps({
id: {
type: String,
required: true, //声明这个参数是否必须传入
},
colorList: {
type: Array,
default: () => ["#1760bc", "#029bff"],
},
alert: { //标记线
type: Number,
default: 300,
},
early: { //标记线
type: Number,
default: 200,
},
xValue: {
type: Array,
default: () => ["2021-09-15", "2021-09-16", "2021-09-17", "2021-09-18", "2021-09-19", "2021-09-20", "2021-09-21"],
},
yValue1: {
type: Array,
default: () => [320, 332, 301, 334, 390, 330, 320],
},
yValue2: {
type: Array,
default: () => [120, 132, 101, 134, 90, 230, 210],
},
});
watch(
() => props.yValue2,
(newValue) => {
drawBar();
},
{
deep: true,
}
);
let charts = ""; // 这里不要让它成为响应式
onMounted(() => {
drawBar();
});
onUnmounted(() => {
window.removeEventListener("resize", selfAdaption);
});
// 初始化echarts
const drawBar = () => {
charts = echarts.init(document.getElementById(props.id));
let option = {
colorList: props.colorList,
tooltip: {
trigger: "axis",
axisPointer: {
// 坐标轴指示器,坐标轴触发有效
type: "shadow", // 默认为直线,可选为:'line' | 'shadow'
},
},
legend: {
data: ["深层位移", "浅层位移"],
textStyle: {
fontSize: fontChart(13),
color: "#7e8390",
},
// itemStyle: {
// borderType: 'dashed',
// borderColor: '#0182d6',
// borderWidth: 1
// }
},
grid: {
left: "6%",
right: "8%",
bottom: "3%",
width: "auto",
height: "auto",
containLabel: true,
},
xAxis: {
type: "category",
data: props.xValue,
offset: fontChart(0), //x轴文字距离x轴的偏移量
axisTick: {
show: false,
alignWithLabel: true,
},
axisLine: {
lineStyle: {
color: "#0f5681",
},
},
axisLabel: {
show: true,
textStyle: {
color: "#7e8390", //更改坐标轴文字颜色
fontSize: fontChart(13), //更改坐标轴文字大小
},
},
},
yAxis: {
// max: 60,
type: "value",
name: "mm", //单位
nameTextStyle: {
fontSize: fontChart(12),
align: "right",
},
axisLabel: {
show: true,
textStyle: {
color: "#7e8390", //更改坐标轴文字颜色
fontSize: fontChart(13), //更改坐标轴文字大小
align: "right",
},
},
splitLine: {
lineStyle: {
color: "#0f5681",
type: "dotted",
},
},
},
series: [
{
name: "深层位移",
type: "bar",
barWidth: "20%",
itemStyle: {
color: "#1760bc",
},
label: {
show: true,
position: "top",
textStyle: {
color: "#fff",
fontSize: fontChart(13),
},
},
data: props.yValue1,
markLine: {
symbol: ["none", "none"], //去掉箭头,
itemStyle: {
normal: {
lineStyle: {
type: "dashed", //线条样式
},
label: {
show: true,
position: "end", // 文字显示的位置
},
},
},
data: [
{
name: "警戒值",
// type: "min",
// valueDim: "close",
yAxis: props.alert, // 标记线x轴的值 警戒线
itemStyle: {
color: "#93101f",
},
},
{
name: "预警值",
// type: "max",
// valueDim: "close",
yAxis: props.early, // 第二条标记线x轴的值 预警线
itemStyle: {
color: "#c36f30",
},
},
],
},
},
{
name: "浅层位移",
type: "bar",
barWidth: "20%",
itemStyle: {
color: "#02bfff",
},
label: {
show: true,
position: "top",
textStyle: {
color: "#fff",
fontSize: fontChart(13),
},
},
data: props.yValue2,
},
],
};
charts.setOption(option);
window.addEventListener("resize", selfAdaption);
};
// 自适应
function selfAdaption() {
if (!charts) return;
charts.resize();
drawBar();
}
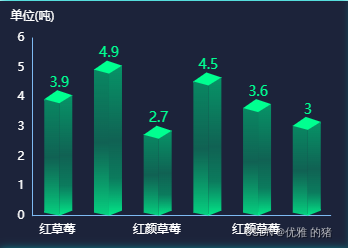
</script>4. 立体柱状图
<template>
  <div :id="id" style="width: 100%; height: 100%"></div>
</template>
<script setup>
import { fontChart } from "@/utils/echartPxToRem";
import * as echarts from "echarts";
import { onMounted, watch, onUnmounted } from "vue";

const props = defineProps({
  id: {
    type: String,
    required: true,
  },
  xValue: {
    type: Array,
    default: () => ["红草莓", "白草莓", "红颜草莓", "甜宝草莓", "红颜草莓",  "甜宝草莓"],
  },
  yValue: {
    type: Array,
    default: () => [3.9, 4.9, 2.7, 4.5, 3.6, 3],
  },
});

watch(
  () => props.yValue,
  (newValue) => {
    drawBar();
  },
  {
    deep: true,
  }
);

let charts = ""; // 这里不要让它成为响应式

onMounted(() => {
  drawBar();
});

onUnmounted(() => {
  window.removeEventListener("resize", selfAdaption);
});
//  初始化echarts
const drawBar = () => {
  charts = echarts.init(document.getElementById(props.id));
  // 绘制左侧面
  const CubeLeft = echarts.graphic.extendShape({
    shape: {
      x: 0,
      y: 0,
    },
    buildPath: function (ctx, shape) {
      // 会canvas的应该都能看得懂,shape是从custom传入的
      const xAxisPoint = shape.xAxisPoint;
      const c0 = [shape.x + 2, shape.y];
      const c1 = [shape.x - 13, shape.y - 1];
      const c2 = [xAxisPoint[0] - 13, xAxisPoint[1] - 3];
      const c3 = [xAxisPoint[0] + 2, xAxisPoint[1]];
      ctx
        .moveTo(c0[0], c0[1])
        .lineTo(c1[0], c1[1])
        .lineTo(c2[0], c2[1])
        .lineTo(c3[0], c3[1])
        .closePath();
    },
  });
  // 绘制右侧面
  const CubeRight = echarts.graphic.extendShape({
    shape: {
      x: 0,
      y: 0,
    },
    buildPath: function (ctx, shape) {
      const xAxisPoint = shape.xAxisPoint;
      const c1 = [shape.x + 2, shape.y];
      const c2 = [xAxisPoint[0] + 2, xAxisPoint[1]];
      const c3 = [xAxisPoint[0] + 15, xAxisPoint[1] - 5];
      const c4 = [shape.x + 15, shape.y - 5];
      ctx
        .moveTo(c1[0], c1[1])
        .lineTo(c2[0], c2[1])
        .lineTo(c3[0], c3[1])
        .lineTo(c4[0], c4[1])
        .closePath();
    },
  });
  // 绘制顶面
  const CubeTop = echarts.graphic.extendShape({
    shape: {
      x: 0,
      y: 0,
    },
    buildPath: function (ctx, shape) {
      const c1 = [shape.x + 2, shape.y + 3];
      const c2 = [shape.x + 15, shape.y - 5]; //右点
      const c3 = [shape.x - 0, shape.y - 10];
      const c4 = [shape.x - 13, shape.y - 1];
      ctx
        .moveTo(c1[0], c1[1])
        .lineTo(c2[0], c2[1])
        .lineTo(c3[0], c3[1])
        .lineTo(c4[0], c4[1])
        .closePath();
    },
  });
  // 注册三个面图形
  echarts.graphic.registerShape("CubeLeft", CubeLeft);
  echarts.graphic.registerShape("CubeRight", CubeRight);
  echarts.graphic.registerShape("CubeTop", CubeTop);
  let option = {
    title: {
      show: false,
      text: "",
      textStyle: {
        color: "#7ebaf2",
        fontWeight: "800",
        fontSize: 12,
      },
      left: "18px",
      top: "1%",
    },
    tooltip: {
      trigger: "axis",
      axisPointer: {
        type: "shadow",
      },
      formatter: function (params, ticket, callback) {
        const item = params[1];
        return item.name + " : " + item.value;
      },
    },
    grid: {
      left: "5%",
      right: "5%",
      top: "15%",
      bottom: "5%",
      containLabel: true,
    },
    xAxis: {
      type: "category",
      data: props.xValue,
      axisLine: {
        show: true,
        lineStyle: {
          color: "#7ebaf2",
        },
      },
      axisTick: {
        show: false,
        length: 9,
        alignWithLabel: true,
        lineStyle: {
          color: "#7DFFFD",
        },
      },
      axisLabel: {
        fontSize: fontChart(12),
        color: "#fff",
      },
    },
    yAxis: {
      type: "value",
      min: 0,
      name: "单位(吨)",
      nameTextStyle: {
        color: "#fff",
        fontSize: fontChart(12),
      },
      axisLine: {
        show: true,
        lineStyle: {
          color: "#7ebaf2",
        },
      },
      splitLine: {
        show: false,
      },
      axisTick: {
        show: false,
      },
      axisLabel: {
        fontSize: fontChart(12),
        color: "#fff",
      },
      boundaryGap: ["20%", "20%"],
    },
    series: [
      {
        type: "custom",
        renderItem: (params, api) => {
          let cubeLeftStyle = "";
          let cubeRightStyle = "";
          let cubeTopStyle = "";
          // 颜色
          cubeLeftStyle = new echarts.graphic.LinearGradient(0, 0, 0, 1, [
            {
              offset: 0,
              color: "rgba(4, 160, 108, .8)",
            },
            {
              offset: 0.5,
              color: "rgba(4, 160, 108, .5)",
            },
            {
              offset: 1,
              color: "rgba(0, 255, 146, .8)",
            },
          ]);
          cubeRightStyle = new echarts.graphic.LinearGradient(0, 0, 0, 1, [
            {
              offset: 0,
              color: "rgba(4, 160, 108, .9)",
            },
            {
              offset: 0.25,
              color: "rgba(4, 160, 108, .7)",
            },
            {
              offset: 0.5,
              color: "rgba(4, 160, 108, .5)",
            },
            {
              offset: 0.75,
              color: "rgba(4, 160, 108, .7)",
            },
            {
              offset: 1,
              color: "rgba(0, 255, 146, .9)",
            },
          ]);
          cubeTopStyle = new echarts.graphic.LinearGradient(0, 0, 0, 1, [
            {
              offset: 0,
              color: "rgba(0, 255, 144, 1)",
            },
            {
              offset: 1,
              color: "rgba(0, 255, 144, 1)",
            },
          ]);
          //颜色end
          const location = api.coord([api.value(0), api.value(1)]);
          return {
            type: "group",
            children: [
              {
                type: "CubeLeft",
                shape: {
                  api,
                  xValue: api.value(0),
                  yValue: api.value(1),
                  x: location[0],
                  y: location[1],
                  xAxisPoint: api.coord([api.value(0), 0]),
                },
                style: {
                  fill: cubeLeftStyle,
                },
              },
              {
                type: "CubeRight",
                shape: {
                  api,
                  xValue: api.value(0),
                  yValue: api.value(1),
                  x: location[0],
                  y: location[1],
                  xAxisPoint: api.coord([api.value(0), 0]),
                },
                style: {
                  fill: cubeRightStyle,
                },
              },
              {
                type: "CubeTop",
                shape: {
                  api,
                  xValue: api.value(0),
                  yValue: api.value(1),
                  x: location[0],
                  y: location[1],
                  xAxisPoint: api.coord([api.value(0), 0]),
                },
                style: {
                  fill: cubeTopStyle,
                },
              },
            ],
          };
        },
        data: props.yValue,
      },
      {
        type: "bar",
        barMaxWidth: 10,
        label: {
          normal: {
            show: true,
            position: "top",
            fontSize: fontChart(14),
            color: "#00ff91",
            offset: [2, -5],
          },
        },
        itemStyle: {
          color: "transparent",
        },
        tooltip: {},
        data: props.yValue,
      },
    ],
  };
  charts.setOption(option);
  window.addEventListener("resize", selfAdaption);
};

//  自适应
function selfAdaption() {
  if (!charts) return;
  charts.resize();
  drawBar();
}
</script>
5. 柱状图折线图滑动光点
<template>
  <div :id="id" style="width: 100%; height: 100%"></div>
</template>
<script>
import * as echarts from "echarts";
import { fontChart } from "@/utils/echartPxToRem.js";
export default {
  data() {
    return {
      charts: "",
    };
  },
  props: {
    id: {
      type: String,
      required: true,
    },
    xValue: {
      type: Array,
      default: () => ([
        "宁玉草莓",
        "香杉草莓",
        "雪兔草莓",
        "白雪公主",
        "桃熏草莓",
        "粉玉草莓",
      ]),
    },
    yValue1: {
      type: Array,
      default: () => [60, 80, 50, 40, 60, 55],
    },
    yValue2: {
      type: Array,
      default: () => [17, 23, 14, 11, 17, 18],
    },
  },
  watch: {
    yValue2() {
      this.drawBar();
    },
  },
  mounted() {
    this.drawBar();
  },
  destroyed() {
    window.removeEventListener("resize", this.selfAdaption);
  },
  methods: {
    handlerTwinkleData() {  // 滑动光点数据
      let list = []
      this.xValue.forEach((item, index) => {
        list.push([item, this.yValue2[index]])
      })
      return list
    },
    drawBar() {
      this.charts = echarts.init(document.getElementById(this.id));
      var img = 'image://data:image/png;base64,iVBORw0KGgoAAAANSUhEUgAAAFAAAABRCAYAAABFTSEIAAAACXBIWXMAAAsSAAALEgHS3X78AAAEp0lEQVR42u3cz4sjRRTA8W9Vd3Vn8mMmjj9WQWSRZQ+CsH+B7MnDIgiCd0E8CYJ/gOAIelo8ehUP/gF6WLw5/gMueFP2sIcF0dHd2Z1kknR11fOQZJJJMtlZd03H7HtQpNOTnpn+8Lrm1etmjIig8e/DKoECKqACKqCGAiqgAiqghgIqoAIqoIYCKqACKqCGAiqgAiqghgIqoAJudKTr+osZMNPvBUQBHwHsPF9fB9R0DeHMOQ6T6WOrhEzXBM4swDOL0M6CrArRVoq3t2dGUIb9fTvatg8ZZup1PDBgzPmy98mey6qfzjLz2WaWjEUZKEvGyi9nWyneMOvGIyFQo2Sbg4MUSChpU9IeTTUpJdsEajPZOJeJG5uBZj7rLLduWS5dGm6XNLEELOFUFj54ACJCaychkpDSASK3bwsXL0YgVpWJKwM0iy9Zy8HdGru7jvt3Pbu7w0wES7drTwAbjTHMGCsQcIAnYTC1/wRx0wEnl27JNgZI8HQ6Kc1mQq83RNzaMjPzXqDbjTQaJRFLxIyyMSxAXEkWrhrQzAAmo5HOjCQf7jflILxOkohL+aUPgV4vEGNJo+E5PAy02+UIMEwBxo0CPDP7Dg5SnEtpt1PA0e87XO25FOoh8IYIH2Y5b45RzGAQBiIltZoHxqMcjbksXAVgdc2EQMYzzzdotyeZWKuleULXJtwT4SODfC2QCWR+IF9KnjuX1Xbo99Op7LVE8iXlz0YBTk5SyLEEjo5OLuccEoFUvHfO+reuUPx4zftXAIcx1hdcF+/TvFab4A0Bs0VwqyhpVnkJT89/Q4DDQ0e77YCMwIUsFMeFZD856699URRvX4nxE4A/jbnxXp7v4Zw3ReGNSDHI8wFQjIafuoyn58L/fB6sth/Ybg9fez2TRC6QZcZYvgHsazF+MP7YCyLXcM7gvSXLDGBqYDg+NhwdmSpPoTrAkub0W+f4FSB1fDucIunMHSLpO8WAH0rSy8u+19MBCHB4OHzd2pI+CEUhpigEiN+l6WcdY252jLn5s7Wf472ImPcN8pUl/tEHoV4XWq1Ke4KrLmPsTA3oODpytFoOyJKSyzHyMSIxteWngMW5cSEdDJQUhTdZVgxOz3/+jFJm4+bA2e5JpNU6WZ4Fw99JwnWMKccwpeddP+B7GZTNUPKqybJy0O+Hs1YfMz9swwvpB8fbGDG0GuGkkK7V0hxSmZQpABI8l2z0v3sJf50qpAMJCd2qCulql3LD1lRGQjm7lEsDz0rkxTQOfiPPxUBcuJTbbhss/Y1eyi3NwsmKInmkZsKk5gtPUzNhvp11507CSy/X6XYStpvFudpZw1ZWIOF4Cq6SdtbKbioJyAhRTu3u9yMJXerN+ugvaQQsjcZ8Q3VnZwxlSDhe1lB9GjrSw5b+1avT8+Jw+979nNaOI6U3KpTrWAosxVQmygK4ld8X0ZtK/7eViExD7O1NQPb3T7fsl4/4sBpwYzPwjFbTo95Yl9l9Vd1YN1X/147HebSjary1AHyc5qc+XLQEQx9ve8Kg6xr6hKoCKqACKqCGAiqgAiqghgIqoAIqoIYCKqACKqCGAiqgAiqghgIq4JrHP8fEWV8FMTmOAAAAAElFTkSuQmCC';
      let option = {
        // backgroundColor: "#111c4e",
        color: ["#3398DB"],
        tooltip: {
          trigger: "axis",
          axisPointer: {
            type: "line",
          },
          formatter: function (params, ticket, callback) {
            const item = params[1];
            return item.name + " : " + item.value;
          },
        },
        grid: {
          left: "10%",
          top: "15%",
          right: "5%",
          bottom: "15%",
          // containLabel: true,
        },
        legend: {
          right: 20,
          textStyle: {
            color: "#ffffff",
            padding: [0, 0, 0, 4],
          },
          // data: ["销量", "销售趋势"],
        },
        xAxis: [
          {
            type: "category",
            gridIndex: 0,
            // boundaryGap: 0,
            data: this.xValue,
            axisTick: {
              show: false,
            },
            axisLine: {
              show: false,
              lineStyle: {
                color: "#0c3b71",
              },
            },
            axisLabel: {
              show: true,
              color: "#fff",
              interval: 0,
              fontSize: fontChart(12),
            },
          },
        ],
        yAxis: [
          {
            //左边y轴
            // type: "value",
            name: "单位(万)", //单位
            nameTextStyle: {
              color: "rgba(255, 255, 255, 1)",
              fontSize: fontChart(13),
              align: "center",
            },
            min: 0,
            max: 120,
            axisLabel: {
              show: true,
              textStyle: {
                color: "#fff", //更改坐标轴文字颜色
                fontSize: fontChart(14), //更改坐标轴文字大小
              },
            },
            splitLine: {
              lineStyle: {
                color: "#0f5681",
                type: "dotted",
              },
            },
          },
          {
            //右边y轴
            // type: "value",
            name: "销售百分比(%)", //单位
            show: false,
            nameTextStyle: {
              color: "rgba(255, 255, 255, 0.8)",
              fontSize: fontChart(13),
              align: "center",
            },
            min: 0,
            max: 25,
            axisLabel: {
              show: true,
              textStyle: {
                color: "#7e8390", //更改坐标轴文字颜色
                fontSize: fontChart(14), //更改坐标轴文字大小
                align: "center",
              },
            },
            splitLine: {
              show: false,
              lineStyle: {
                color: "#0f5681",
                type: "dotted",
              },
            },
          },
        ],
        series: [
          {
            // 分隔
            name: "销量",
            type: "pictorialBar",
            itemStyle: {
              normal: {
                color: "#00d7fe",
              },
            },
            symbolRepeat: "fixed",
            symbolMargin: 4,
            symbol: "rect",
            symbolClip: true,
            symbolSize: [20, 8],
            symbolPosition: "start",
            symbolOffset: [0, -1],
            data: this.yValue1,
            // width: 25,
            z: 0,
            zlevel: 8,
          },
          {
            // name: "销售百分比(%)",
            name: "销量趋势",
            yAxisIndex: 1,
            type: "line",
            smooth: false,
            showSymbol: false,
            areaStyle: {
              normal: {
                color: new echarts.graphic.LinearGradient(0, 0, 0, 1, [{
                        offset: 0,
                        color: 'rgba(108,80,243,0.3)'
                    },
                    {
                        offset: 1,
                        color: 'rgba(108,80,243,0)'
                    }
                ], false),
                shadowColor: 'rgba(108,80,243, 0.9)',
                shadowBlur: 20
              },
            },
            data: this.yValue2,
            // symbol: "circle",
            // symbolSize: 8,
            itemStyle: {
              normal: {
                color: "#ffffff",
                borderColor: "#2080F7",
                lineStyle: {
                  color: "#00bbde",
                },
              },
            },
          },
          {
            // name: "滑行的光点",
            type: "lines",
            yAxisIndex: 1,
            coordinateSystem: "cartesian2d",
            symbolSize: 30,
            polyline: true,
            effect: {
              show: true,
              trailLength: 0,
              symbol: "arrow",
              period: 10, //光点滑动速度
              symbolSize: 150,  // 或[<宽>, <高>]
              symbol: img
            },
            lineStyle: {
              normal: {
                width: 1,
                opacity: 0.6,
                curveness: 0.2
              },
            },
            data: [
              {
                coords: this.handlerTwinkleData(),  // 一个二维数组
              },
            ],
          }
        ]
      };
      this.charts.setOption(option);
      window.addEventListener("resize", this.selfAdaption);
    },
    // 自适应
    selfAdaption() {
      if (!this.charts) return;
      this.charts.resize();
      this.drawBar();
    },
  },
};
</script>
6. 象形柱状图

<template>
  <div :id="id" style="width: 100%; height: 100%"></div>
</template>
<script setup>
import { fontChart } from "@/utils/echartPxToRem";
import * as echarts from "echarts";
import { onMounted, watch, onUnmounted } from "vue";

const props = defineProps({
  id: {
    type: String,
    required: true,
  },
  xValue: {
    type: Array,
    default: () => ["1:00", "2:00", "3:00", "4:00", "5:00", "6:00", "7:00", "8:00", "9:00", "10:00", "11:00", "12:00", "13:00", "14:00", "15:00", "16:00", "17:00"],
  },
  maxValue: {
    type: Array,
    default: () => [50000, 50000, 50000, 50000, 50000, 50000, 50000, 50000, 50000, 50000, 50000, 50000, 50000, 50000, 50000, 50000, 50000],
  },
  yValue: {
    type: Array,
    default: () => [6000, 6000, 6000, 6000, 6000, 6000, 6000, 6000, 20000, 27000, 29000, 30000, 35000, 31000, 27000, 19000, 18000],
  },
});

watch(
  () => props.yValue,
  (newValue) => {
    drawBar();
  },
  {
    deep: true,
  }
);

let charts = ""; // 这里不要让它成为响应式

onMounted(() => {
  drawBar();
});

onUnmounted(() => {
  window.removeEventListener("resize", selfAdaption);
});
//  初始化echarts
const drawBar = () => {
  charts = echarts.init(document.getElementById(props.id));
  let option = {
    // backgroundColor: "rgba(5,39,58,1)", //背景色
    tooltip: {
      show: false,
      trigger: "axis",
      borderRadius: fontChart(5),
      borderColor: "#6baab2",
      borderWidth: fontChart(1),
      formatter: function (params) {
        return params[0].value + ""; // 必须return 字符串
        // return (
        //   params[0].data.nameCode +
        //   "<br>" +
        //   "杆塔数量(基数) :" +
        //   params[0].value
        // );
      },
    },
    grid: {
      left: "2%",
      right: "3%",
      bottom: "2%",
      top: "15%",
      containLabel: true,
    },
    xAxis: {
      data: props.xValue,
      triggerEvent: true,
      axisTick: {
        show: false,
      },
      axisLine: {
        show: false,
      },
      axisLabel: {
        show: true,
        textStyle: {
          color: "#fff",
        },
      },
    },
    yAxis: {
      name: "单位(lus)",
      triggerEvent: true,
      nameTextStyle: {
        color: "#fff",
        fontSize: fontChart(13),
        align: "right",
      },
      splitLine: {
        show: true,
        lineStyle: {
          color: "rgba(255,255,255,.1)",
        },
      },
      axisTick: {
        show: false,
      },
      axisLine: {
        show: true,
        lineStyle: {
          color: "rgba(255,255,255,.1)",
        },
      },
      axisLabel: {
        show: true,
        textStyle: {
          color: "#fff",
          fontSize: fontChart(13),
        },
      },
    },
    // color: ["#e54035"],
    series: [
      {
        name: "hill",
        barMinHeight: fontChart(10),
        barMinWidth: fontChart(15),
        type: "pictorialBar",
        barCategoryGap: "80%",
        // symbol: 'path://M0,10 L10,10 L5,0 L0,10 z',
        symbol: "path://M0,10 L10,10 C5.5,10 5.5,5 5,0 C4.5,5 4.5,10 0,10 z",
        itemStyle: {
          normal: {
            //barBorderRadius: 5,
            //渐变色
            color: new echarts.graphic.LinearGradient(0, 0, 1, 0, [
              {
                offset: 0,
                color: "gray",
              },
              {
                offset: 0.3,
                color: "gray",
              },
              {
                offset: 0.5,
                color: "#fff",
              },
              {
                offset: 0.7,
                color: "gray",
              },
              {
                offset: 1,
                color: "gray",
              },
            ]),
          },
        },
        label: {
          normal: {
            show: false,
            position: "top",
            textStyle: {
              color: "#fff",
              fontSize: fontChart(13),
            },
          },
        },
        data: props.yValue,
        z: 10,
      },
      {
        name: "hill",
        type: "pictorialBar",
        // type: "bar",
        // barWidth: '%',
        barMinWidth: fontChart(15),
        symbol: "path://M0,10 L10,10 C5.5,10 5.5,5 5,0 C4.5,5 4.5,10 0,10 z",
        itemStyle: {
          normal: {
            color: "rgba(11,47,68,1)",
          },
        },
        data: props.maxValue,
        z: 9,
      }
    ]
  };
  charts.setOption(option);
  window.addEventListener("resize", selfAdaption);
};

//  自适应
function selfAdaption() {
  if (!charts) return;
  charts.resize();
  drawBar();
}
</script>
7. 一条横向格子柱状图(表示PH值等)

<template>
  <div :id="id" style="width: 100%; height: 100%"></div>
</template>
<script setup>
import { fontChart } from "@/utils/echartPxToRem";
import * as echarts from "echarts";
import { onMounted, watch, onUnmounted } from "vue";

const props = defineProps({
  id: {
    type: String,
    required: true,
  },
  value: {
    type: Number,
    default: 5.9,
  },
});

watch(
  () => props.yValue,
  (newValue) => {
    drawBar();
  },
  {
    deep: true,
  }
);

let charts = ""; // 这里不要让它成为响应式

onMounted(() => {
  drawBar();
});

onUnmounted(() => {
  window.removeEventListener("resize", selfAdaption);
});
//  初始化echarts
const drawBar = () => {
  charts = echarts.init(document.getElementById(props.id));
  let option = {
    // backgroundColor: "balck",
    xAxis: {
      splitLine: {
        show: false,
      },
      axisLabel: {
        show: false,
      },
      axisTick: {
        show: false,
      },
      axisLine: {
        show: false,
      },
    },
    grid: {
      containLabel: true,
      left: "5%",
      top: "15%",
      right: "15%",
      bottom: 0,
    },
    yAxis: [
      {
        inverse: true,
        axisLine: {
          show: false,
        },
        axisTick: {
          show: false,
        },
        axisLabel: {
          show: false,
          margin: fontChart(10),
          textStyle: {
            fontSize: fontChart(14),
            color: "#fff",
          },
        },
        data: ["PH值"],
      },
    ],
    series: [
      {
        //内
        type: "bar",
        barWidth: fontChart(18),
        legendHoverLink: false,
        symbolRepeat: true,
        silent: true,
        itemStyle: {
          color: {
            type: "linear",
            x: 0,
            y: 0,
            x2: 1,
            y2: 0,
            colorStops: [
              {
                offset: 0,
                color: "#ff9779", // 0% 处的颜色
              },
              {
                offset: 1,
                color: "#ffc079", // 100% 处的颜色
              },
            ],
          },
        },
        data: [
          {
            name: "PH值",
            value: props.value,
          },
        ],
        z: 1,
        animationEasing: "elasticOut",
      },
      {
        // 背景
        type: "pictorialBar",
        animationDuration: 0,
        symbolRepeat: "fixed",
        symbolMargin: "20%",
        symbol: "roundRect",
        symbolSize: [6, 18],
        itemStyle: {
          normal: {
            color: "#ccc",
          },
        },
        label: {
          normal: {
            show: true,
            position: "right",
            offset: [0, 2],
            distance: fontChart(30),
            textStyle: {
              color: "#7AF8FF",
              fontSize: fontChart(14),
            },
            formatter: function (a, b) {
              return `${(a.value / 1.2).toFixed(1)}`;
            },
          },
        },
        data: [props.value * 1.2],  // 这个是右边未到达的范围  修改一下数据试试就明白啦
        z: 0,
        animationEasing: "elasticOut",
      },
      {
        //分隔
        type: "pictorialBar",
        itemStyle: {
          color: "#000",
        },
        symbolRepeat: "fixed",
        symbolMargin: fontChart(4),
        symbol: "roundRect",
        symbolClip: true,
        symbolSize: [2, 18],
        symbolPosition: "start",
        symbolOffset: [0, 0],
        data: [
          {
            name: "PH值",
            value: props.value,
          },
        ],
        z: 2,
        animationEasing: "elasticOut",
      },
    ],
  };
  charts.setOption(option);
  window.addEventListener("resize", selfAdaption);
};

//  自适应
function selfAdaption() {
  if (!charts) return;
  charts.resize();
  drawBar();
}
</script>
8. 紧凑分格柱状图

<template>
<div :id="id" style="width: 100%; height: 100%"></div>
</template>
<script setup>
import { fontChart } from "@/utils/echartPxToRem";
import * as echarts from "echarts";
import { onMounted, watch, onUnmounted } from "vue";
const props = defineProps({
id: {
type: String,
required: true,
},
xValue: {
type: Array,
default: () => ["死因", "伤情", "DNA", "指纹", "足迹", "毒物", "毒品", "微量", "笔记", "印章", "视频", "电物", "语音"],
},
yValue: {
type: Array,
default: () => [498, 520, 568, 432, 464, 332, 344, 458, 470, 468, 398, 310, 421]
},
waikuangValue: {
type: Array,
default: () => [100, 100, 100, 100, 100, 100, 100]
}
});
watch(
() => props.yValue,
(newValue) => {
drawBar();
},
{
deep: true,
}
);
let charts = ""; // 这里不要让它成为响应式
onMounted(() => {
drawBar();
});
onUnmounted(() => {
window.removeEventListener("resize", selfAdaption);
});
// 初始化echarts
const drawBar = () => {
charts = echarts.init(document.getElementById(props.id));
let option = {
// backgroundColor: "#031d33",
animation: true,
grid: {
top: "10%",
left: '15%',
bottom: "15%",
right: "5%",
},
tooltip: {
show: true,
},
xAxis: {
data: props.xValue,
axisLine: {
show: false, //隐藏X轴轴线
},
axisTick: {
show: false, //隐藏X轴轴线
},
splitLine: {
show: true,
lineStyle: {
color: "rgba(77, 128, 254, 0.2)",
width: 2,
},
},
axisLabel: {
show: true,
// interval: 0,
// margin: 14,
fontSize: 13,
textStyle: {
color: "#a8d5ff", //X轴文字颜色
},
},
},
yAxis: [
{
type: "value",
gridIndex: 0,
min: 0,
//max: 100,
interval: 100,
// splitNumber: 4,
splitLine: {
show: true,
lineStyle: {
color: "rgba(77, 128, 254, 0.2)",
width: 2,
},
},
axisTick: {
show: false,
},
axisLine: {
show: true,
lineStyle: {
color: "rgba(77, 128, 254, 0.2)",
},
},
axisLabel: {
show: true,
margin: 14,
fontSize: 13,
textStyle: {
color: "#a8d5ff",
},
},
},
],
series: [
{
name: "设备在线率",
type: "bar",
barWidth: 16,
itemStyle: {
normal: {
label: {
show: true, //开启显示
position: "top", //在上方显示
textStyle: {
//数值样式
color: "#fff",
fontSize: 16,
},
},
color: new echarts.graphic.LinearGradient(0, 0, 0, 1, [
{
offset: 0,
color: "rgba(146, 225, 255, 1)",
},
{
offset: 1,
color: "rgba(0, 151, 251, 1)",
},
]),
},
},
data: props.yValue,
z: 10,
zlevel: 0,
},
{
// 分隔
type: "pictorialBar",
itemStyle: {
normal: {
color: "#0F375F",
},
},
symbolRepeat: "fixed",
symbolMargin: 6,
symbol: "rect",
symbolClip: true,
symbolSize: [18, 2],
symbolPosition: "start",
symbolOffset: [1, 1],
data: props.yValue,
width: 2,
z: 0,
zlevel: 1,
},
{
name: "外框",
type: "bar",
barGap: "-110%", // 设置外框粗细
data: props.waikuangValue,
barWidth: 16,
itemStyle: {
normal: {
color: "transparent", // 填充色
// barBorderRadius: 0, //圆角半径
label: {
// 标签显示位置
show: false,
position: "top", // insideTop 或者横向的 insideLeft
},
},
},
z: 0,
},
{
name: "背影",
type: "line",
smooth: true, //平滑曲线显示
showAllSymbol: false, //显示所有图形。
symbolSize: 0,
lineStyle: {
width: 0,
},
areaStyle: {
color: "rgba(0, 151, 251, 0.1)",
},
data: props.yValue,
z: 5,
},
],
// dataZoom: [
// {
// type: "slider",
// show: false,
// xAxisIndex: [0],
// endValue: 14,
// startValue: 0
// }
// ]
};
charts.setOption(option);
window.addEventListener("resize", selfAdaption);
};
// 自适应
function selfAdaption() {
if (!charts) return;
charts.resize();
drawBar();
}
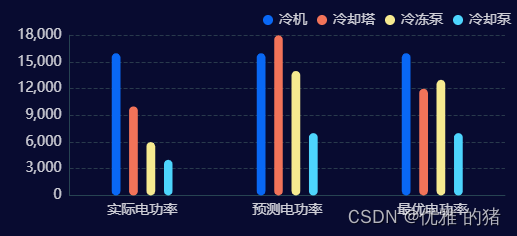
</script>9. 圆角柱状图
option = {
  backgroundColor: "#080b30",
  title: {
    show: false,
    text: "汪琦玲-拉动时间轴演示",
    textStyle: {
      align: "center",
      color: "#fff",
      fontSize: 20,
    },
    top: "5%",
    left: "center",
  },
  tooltip: {
    trigger: "axis",
    axisPointer: {
      // 坐标轴指示器,坐标轴触发有效
      type: "shadow", // 默认为直线,可选为:'line' | 'shadow'
    },
  },
  grid: {
    left: "4%",
    right: "4%",
    bottom: "10%",
    top: "16%",
    containLabel: true,
  },
  legend: {
    // data: ["1", "2", "3"],
    right: fontChart(10),
    top: fontChart(12),
    textStyle: {
      color: "rgba(255, 255, 255, 0.8)",
      fontSize: fontChart(14)
    },
    icon: 'circle',
    itemWidth: fontChart(12),
    itemHeight: fontChart(10),
    // itemGap: 35
  },
  xAxis: {
    type: "category",
    data: this.xValue,
    axisLine: {
      lineStyle: {
        color: "#274452",
      }
    },
    axisTick: {
      show: false,
      alignWithLabel: true
    },
    axisLabel: {
      show: true,
      // interval: 0,
      // rotate: fontChart(12),
      color: 'rgba(255, 255, 255, 0.8)',  //更改坐标轴文字颜色
      fontSize: fontChart(14),     //更改坐标轴文字大小
      align:"center"
    }
  },
  yAxis: {
    type: "value",
    // max: "1200",
    axisLine: {
      show: true,
      lineStyle: {
        color: "#274452",
      }
    },
    axisTick: {
      show: false,
      alignWithLabel: true
    },
    splitLine: {
      show: true,
      lineStyle: {
        color: "#293a4c",
        type: 'dashed'
      }
    },
    axisLabel: {
      show: true,
      // interval: 0,
      // rotate: fontChart(12),
      color: 'rgba(255, 255, 255, 0.8)',  //更改坐标轴文字颜色
      fontSize: fontChart(14),     //更改坐标轴文字大小
    }
  },
  dataZoom: [
    {
      show: false,
      height: 12,
      xAxisIndex: [0],
      bottom: "8%",
      start: 10,
      end: 90,
      handleIcon: "path://M306.1,413c0,2.2-1.8,4-4,4h-59.8c-2.2,0-4-1.8-4-4V200.8c0-2.2,1.8-4,4-4h59.8c2.2,0,4,1.8,4,4V413z",
      handleSize: "110%",
      handleStyle: {
        color: "#d3dee5",
      },
      textStyle: {
        color: "#fff",
      },
      borderColor: "#90979c",
    },
    {
      type: "inside",
      show: true,
      height: 15,
      start: 1,
      end: 35,
    },
  ],
  series: [
    {
      name: "冷机",
      type: "bar",
      barWidth: "6%",
      itemStyle: {
        color: '#0968f5',
        barBorderRadius: 12,
      },
      data: this.yValue1,
    },
    {
      name: "冷却塔",
      type: "bar",
      barWidth: "6%",
      itemStyle: {
        color: '#f27359',
        barBorderRadius: 11,
      },
      data: this.yValue2,
    },
    {
      name: "冷冻泵",
      type: "bar",
      barWidth: "6%",
      itemStyle: {
        color: '#f6ea90',
        barBorderRadius: 11,
      },
      data: this.yValue3,
    },
    {
      name: "冷却泵",
      type: "bar",
      barWidth: "6%",
      itemStyle: {
        color: '#4dd5fd',
        barBorderRadius: 11
      },
      barGap:"100%", //不同系列的柱间距离,为百分比
      // barCategoryGap: '20%', //同一系列的柱间距离,默认为类目间距的20%,可设固定值
      data: this.yValue4,
    }
  ]
};版权声明:本文为m0_51431448原创文章,遵循CC 4.0 BY-SA版权协议,转载请附上原文出处链接和本声明。