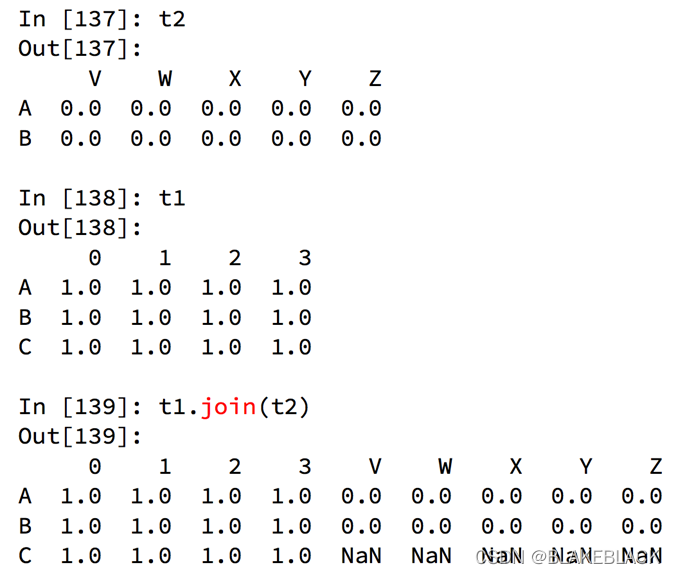
数据合并之join
join:默认情况下他是把行索引相同的数据合并到一起
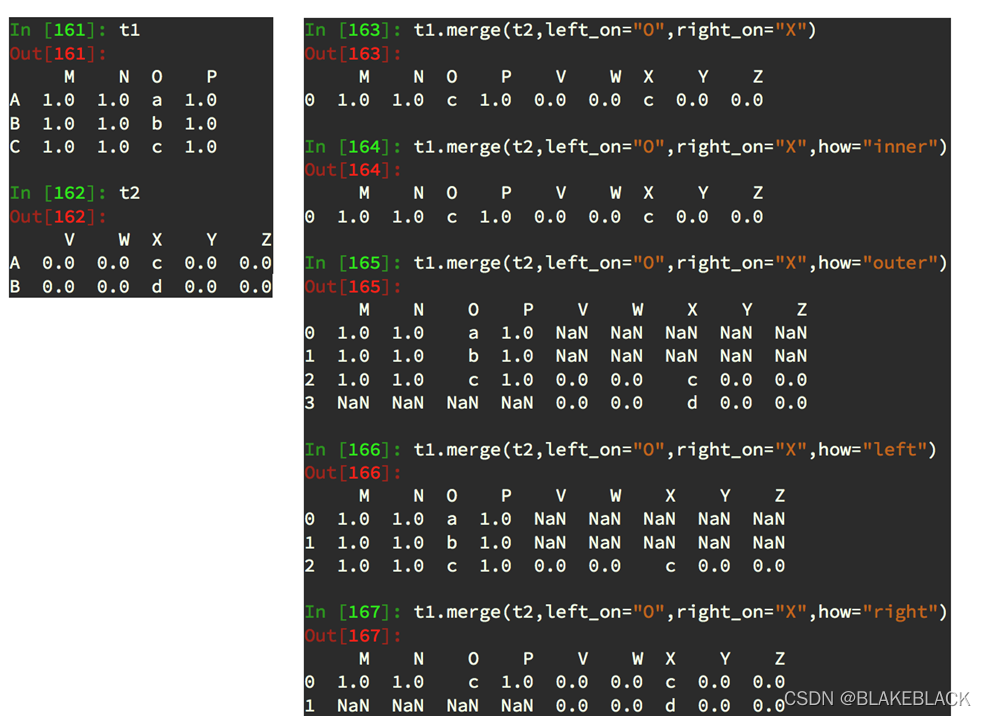
数据合并之merge
merge:按照指定的列把数据按照一定的方式合并到一起
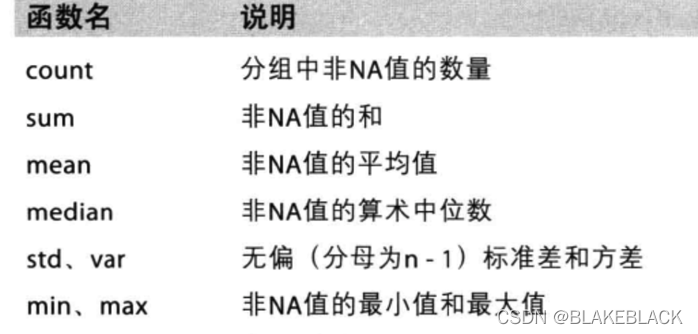
分组和聚合
在pandas中类似的分组的操作我们有很简单的方式来完成
df.groupby(by="columns_name")
grouped = df.groupby(by="columns_name")
grouped是一个DataFrameGroupBy对象,是可迭代的
grouped中的每一个元素是一个元组
元组里面是(索引(分组的值),分组之后的DataFrame)
索引和复合索引
简单的索引操作:
• 获取 index : df.index
• 指定 index : df.index = [' x','y ']
• 重新设置 index : df.reindex (list(" abcedf "))
• 指定某一列作为 index : df.set_index (" Country",drop =False)
• 返回 index 的唯一值: df.set_index ("Country"). index.unique ()
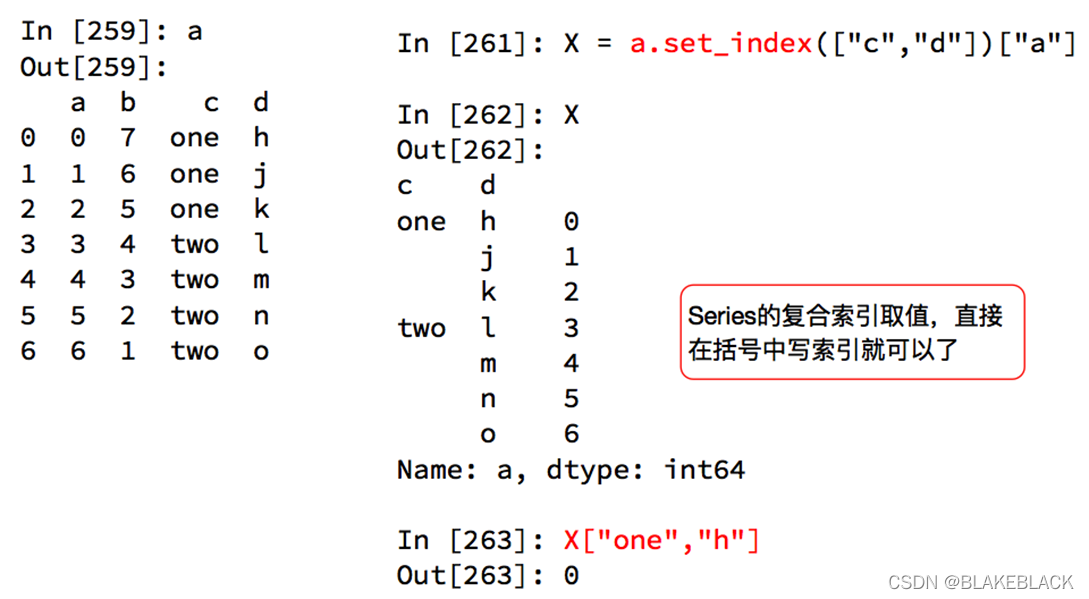
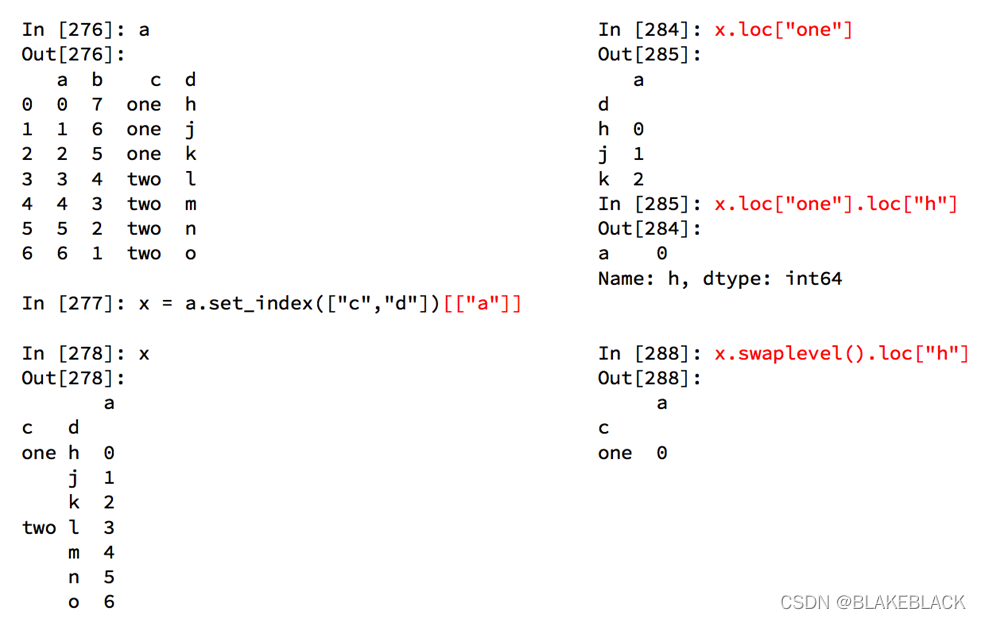
Series复合索引
DataFrame复合索引
import pandas as pd
from matplotlib import pyplot as plt
file_path = "./books.csv"
df = pd.read_csv(file_path)
# print(df.head(4))
# print(df.info())
# data1 = df[pd.notnull(df["original_publication_year"])]
# grouped = data1.groupby(by="original_publication_year").count()["title"]
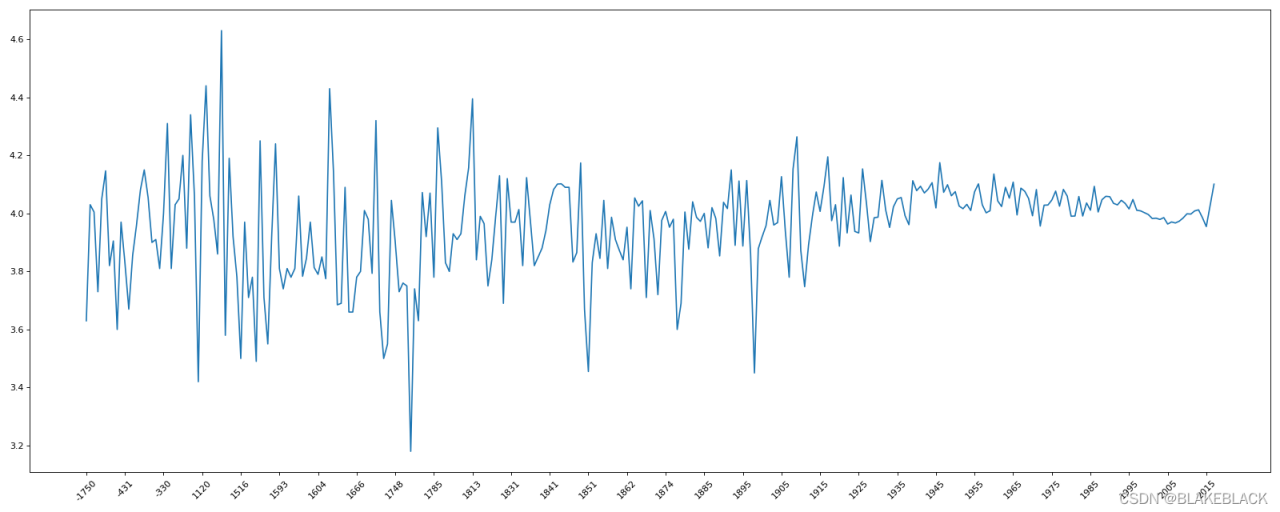
#不同年份书的平均评分情况
#去除original_publication_year列中nan的行
data1 = df[pd.notnull(df["original_publication_year"])]
grouped = data1["average_rating"].groupby(by=data1["original_publication_year"]).mean()
# #显示所有列
# pd.set_option('display.max_columns', None)
# #显示所有行
# pd.set_option('display.max_rows', None)
# #设置value的显示长度为100,默认为50
# pd.set_option('max_colwidth',100)
_x = grouped.index
_y = grouped.values
#画图
plt.figure(figsize=(20,8),dpi=80)
plt.plot(range(len(_x)),_y)
print(len(_x))
plt.xticks(list(range(len(_x)))[::10],_x[::10].astype(int),rotation=45)
plt.show()
print(grouped)#不同年份书的平均评分情况
#使用matplotlib呈现出中国每个城市的数量
# coding=utf-8
import pandas as pd
from matplotlib import pyplot as plt
from matplotlib import font_manager

my_font = font_manager.FontProperties(fname="C:/WINDOWS/Fonts/方正粗黑宋简体.ttf")
file_path = "./starbucks_store_worldwide.csv"

df = pd.read_csv(file_path)
df = df[df["Country"]=="CN"]

#使用matplotlib呈现出中国每个城市的数量
#准备数据
data1 = df.groupby(by="City").count()["Brand"].sort_values(ascending=False)[:25]

_x = data1.index
_y = data1.values

#画图
plt.figure(figsize=(20,12),dpi=80)

# plt.bar(range(len(_x)),_y,width=0.3,color="orange")
plt.barh(range(len(_x)),_y,height=0.3,color="orange")

plt.yticks(range(len(_x)),_x,fontproperties=my_font)

plt.show()
版权声明:本文为Blake123444原创文章,遵循CC 4.0 BY-SA版权协议,转载请附上原文出处链接和本声明。