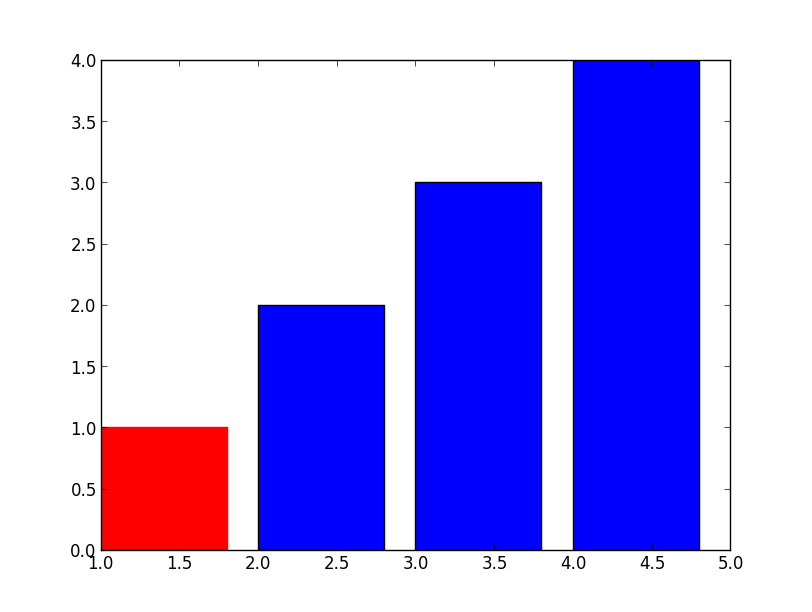
简单,只要使用.set_color>>> barlist=plt.bar([1,2,3,4], [1,2,3,4])
>>> barlist[0].set_color('r')
>>> plt.show()
对于你的新问题,也不难,只需要从你的坐标轴上找到条,例如:>>> f=plt.figure()
>>> ax=f.add_subplot(1,1,1)
>>> ax.bar([1,2,3,4], [1,2,3,4])
>>> ax.get_children()
[,
,
,
,
,
,
,
,
,
,
,
]
>>> ax.get_children()[2].set_color('r')
#You can also try to locate the first patches.Rectangle object
#instead of direct calling the index.
如果您有一个复杂的绘图,并且希望首先标识条形图,请添加以下内容:>>> import matplotlib
>>> childrenLS=ax.get_children()
>>> barlist=filter(lambda x: isinstance(x, matplotlib.patches.Rectangle), childrenLS)
[,
,
,
,
]
版权声明:本文为weixin_36087877原创文章,遵循CC 4.0 BY-SA版权协议,转载请附上原文出处链接和本声明。