前两天偶然翻阅了一位blogger的文章,内容是记录了他个人油管的观看记录分析过程。然后我也心血来潮,效仿一番,在本篇文章也简单分析下我自己再youtube的观看历史,分析维度和那位blogger的基本一致(抄袭了别人的idea,惭愧~),这是原文链接。
曾几何时,还不知道有fanqiang这回事的时候,在网络上观看视频资源都只能局限于几大视频平台。后来学会了用别人的飞机场,再后来学会了自己搭梯子。慢慢地才得以打开围墙外世界的一道道大门,而youtube(油管)就是其一。
从两年前开始,我已经很少使用国内的几大视频平台了,其中包括抖音,腾讯视频,爱奇艺,优酷土豆等等主流平台,但还是保留观看bilibili和网易新闻客户端的视频习惯。当然,电影、电视剧这些类型的“长视频”并不在本文所指的视频资源范围内。
之所以开始放弃使用国内这些平台,主要是出于以下两个原因考虑:
视频内容质量堪忧。伴随着近两年国内自媒体大火,大多平台的视频内容来源于这些水平参差不齐的自媒体人,所以可以想象视频内容的营养价值有多少水分。做自媒体门槛并不高,稍微有点拍摄设备和会点剪辑技能就能入门了。虽然我并未接触过自媒体相关的工作,但像拍摄视频这样丰富的内容承载媒介,要想输出足够有观看价值的内容,我觉得并不是一件简单的事情;
内容同质化严重。这个不用多说了,互相抄袭idea、一窝蜂抢舆论热点、甚至于直接照搬他人视频等现象太多了;
截至目前,油管算是我视频资源观看量最大的平台了,因为油管视频内容丰富,总能找到感兴趣的video或channel。以下篇幅大致记录了在分析过程中使用到的一些主要工具,以及有几个基于不同分析维度的svg图表。
准备工具
Python3。用于编写获取视频信息、过滤并保存待分析数据、以及生成可视化图表的脚本,当然完全可以使用其他语言来完成这部分工作,但whatever,毕竟人生苦短,我用Python;[狗头]~
sqlite3。用于保存过滤后的待分析数据,做数据的持久化是为了方便后面生成可视化图表;
chrome。用于渲染展示svg格式的图表,当然也可以使用其他可展示svg格式图表的工具;
准备观看历史数据
在谷歌提供的此工具页面可以导出在油管的视频观看历史数据;链接:Google Tokeout
前面获取的观看历史数据只是一些基础数据,还需要另外获取每个视频的其他属性,这样才可以有更多维度做分析,有个开源库youtube-dl 提供了获取油管视频更多属性信息的接口,在此库基础上我们就可以做更多感兴趣维度的分析了;
感兴趣的几个分析维度
2019年每个月观看的视频量情况
2019年每天24小时的视频观看量的分布情况
观看量最多的前八个channel及其视频观看量;
观看的视频时间长度的分布情况;
基于sqlite3数据库的数据表创建
CREATE TABLE `channel` (
   "channel_id" TEXT  NOT NULL PRIMARY KEY,
   "name" TEXT NOT NULL,
   "view_count" INTEGER
);


CREATE TABLE `video` (
   "video_id" TEXT  NOT NULL PRIMARY KEY,
   "title" TEXT NOT NULL,
   "video_url" TEXT NOT NULL,
   "channel_id" TEXT  NOT NULL,
   "duration" INTEGER
);

CREATE TABLE `history` (
   "history_id" INTEGER PRIMARY KEY AUTOINCREMENT,
   "video_id" TEXT  NOT NULL,
   "timestamp" TEXT NOT NULL
);
用于清洗、保存待分析数据的python脚本
#!/usr/bin/env python3
# -*- coding: utf-8 -*-

import youtube_dl
import json
import sqlite3
from datetime import datetime
import re
import os
import logging
import threading
import time
from dateutil import parser
from collections import defaultdict


logging.getLogger().setLevel(logging.INFO)


db_conn = sqlite3.connect(database=os.path.join(os.path.dirname(__file__), "youtube.db"))
video_base_url = "http://www.youtube.com/watch?v={}"


def add_channel(channel_id, channel_name):
    c = db_conn.cursor()
    c.execute("INSERT OR IGNORE INTO channel (channel_id, name) VALUES (?, ?)", (channel_id, channel_name))


def update_channel_view_count(channel_id, view_count):
    c = db_conn.cursor()
    c.execute("UPDATE channel SET view_count=? WHERE channel_id=? ", (view_count, channel_id))


def add_video_record(video_id, title, video_url, channel_id, duration):
    c = db_conn.cursor()
    c.execute("INSERT OR IGNORE INTO video (video_id, title, video_url, channel_id, duration) VALUES (?, ?, ?, ?, ?)", (video_id, title, video_url, channel_id, duration))


def add_history(video_id, timestamp):
    c = db_conn.cursor()
    c.execute("INSERT OR IGNORE INTO history (video_id, timestamp) VALUES (?, ?)", (video_id, timestamp))


def get_channel_id(url: str):
    if not url:
        return ""
    pattern = re.compile(r"^\S+/channel/(\S+)$")
    res = re.findall(pattern, url)
    if res:
        return res[0]
    return ""


def get_video_id(url: str):
    if not url:
        return ""
    pattern = re.compile(r"^\S+/watch\?v=(\S+)$")
    res = re.findall(pattern, url)
    if res:
        return res[0]
    return ""


def download_from_ydl(ydl: youtube_dl.YoutubeDL, video_url: str, cache_file_path: str):
    try:
        result = ydl.extract_info(video_url, download=False)
    except Exception as e:
        logging.exception(str(e))
        result = {}

    with open(cache_file_path, "w") as f:
        json.dump(result, f)


def get_duration(ydl: youtube_dl.YoutubeDL, video_id: str):
    video_url = video_base_url.format(video_id)
    cache_file_path = os.path.join(os.path.dirname(__file__), "cache", video_id + ".json")

    if not os.path.exists(cache_file_path):
        logging.info("download video info: {}".format(cache_file_path))
        download_from_ydl(ydl, video_url, cache_file_path)

    duration = -1
    with open(cache_file_path, "r") as f:
        data = json.load(f)
        duration = data.get("duration") if data else -1
    return duration


def handle(history: dict, ydl: youtube_dl.YoutubeDL, channel_view_counts: dict):
    if "subtitles" not in history or "titleUrl" not in history:
        return
    video_id = get_video_id(history.get("titleUrl"))
    title = history.get("title", "").replace("Watched ", "")
    logging.info("current item title: {}".format(title))

    channel_id = ""

    for subtitle in history["subtitles"]:
        channel_id = get_channel_id(subtitle.get("url"))
        add_channel(channel_id, subtitle.get("name", ""))
        channel_view_counts[channel_id] += 1

    duration = get_duration(ydl, video_id)
    add_video_record(video_id, title, history.get("titleUrl"), channel_id, duration)

    timestamp = int(parser.parse(history["time"]).timestamp())
    add_history(video_id, timestamp)
    return


def batch_add_channel_view_count(channel_count: dict):
    if not channel_count:
        return

    for channel_id, view_count in channel_count.items():
        logging.info("current channel id:{}, view count:{}".format(channel_id, str(view_count)))
        update_channel_view_count(channel_id, view_count)
    db_conn.commit()
    return


def batch_download_video_info(ydl: youtube_dl.YoutubeDL, video_id: str):
    video_url = video_base_url.format(video_id)
    cache_file_path = os.path.join(os.path.dirname(__file__), "cache", video_id + ".json")

    if not os.path.exists(cache_file_path):
        logging.info("batch download video info: {}".format(cache_file_path))
        download_from_ydl(ydl, video_url, cache_file_path)
        time.sleep(1)
    logging.info("finish batch download")

def main():
    logging.info("========= start work =========")
    ydl = youtube_dl.YoutubeDL({"outtmpl": "%(id)s%(ext)s"})
    threads = []

    history_file_path = os.path.join(os.path.dirname(__file__), "history.json")
    with open(history_file_path, "r", encoding="utf-8") as f:
        historys = json.load(f)

    for history in historys:
        video_id = get_video_id(history.get("titleUrl"))
        t = threading.Thread(target=batch_download_video_info, args=(ydl, video_id))
        t.start()
        threads.append(t)
    for t in threads:
        t.join()

    channel_view_counts = defaultdict(int)
    for history in historys:
        handle(history, ydl, channel_view_counts)
        db_conn.commit()

    batch_add_channel_view_count(channel_view_counts)


    db_conn.close()
    logging.info("========= finish work =========")


if __name__ == "__main__":
    main()
用于输出svg格式图表的python脚本
#!/usr/bin/env python3
# -*- coding: utf-8 -*-

import sqlite3
import matplotlib.pyplot as pplt
import os

db_conn = sqlite3.connect(database=os.path.join(os.path.dirname(__file__), "youtube.db"))


def plot_yearly_data():
    x, y = [], []
    c = db_conn.cursor()
    c.execute("""
    SELECT
        STRFTIME('%Y', DATE(timestamp, 'unixepoch')) AS year,
        COUNT(1)
    FROM
        history
    GROUP BY 1;
    """)

    result = c.fetchall()
    for item in result:
        x.append(item[0])
        y.append(item[1])

    pplt.bar(x, y)
    pplt.xlabel("Year")
    pplt.ylabel("Video")
    pplt.title("Yearly Watched Videos")
    pplt.legend()


def plot_watch_hour():
    x, y = [], []
    c = db_conn.cursor()
    c.execute("""
    SELECT
        STRFTIME('%Y', DATETIME(timestamp, 'unixepoch', 'localtime')) AS year,
        STRFTIME('%H', DATETIME(timestamp, 'unixepoch', 'localtime')) AS hour,
        COUNT(1)
    FROM history GROUP BY 1, 2 HAVING year = '2019';
    """)

    result = c.fetchall()
    for item in result:
        x.append(int(item[1]))
        y.append(int(item[2]))

    pplt.bar(x, y)
    pplt.xlabel("Hour")
    pplt.ylabel("Video")
    pplt.title("Watched In Hour (2019) ")
    pplt.legend()


def plot_top_five():
    x, y = [], []
    c = db_conn.cursor()
    c.execute("""
    SELECT
        name,
        view_count
    FROM channel ORDER BY view_count DESC LIMIT 8;
    """)

    result = c.fetchall()
    for item in result:
        x.append(str(item[0]).encode(encoding="utf-8"))
        y.append(int(item[1]))

    pplt.bar(x, y)
    pplt.ylim(0, 120)
    pplt.xlabel("Channel Name")
    pplt.ylabel("View Count")
    pplt.title("Channel View Count (2019) ")
    pplt.legend()


def plot_video_length():

    x, y = [], []

    c = db_conn.cursor()
    c.execute("""
    SELECT
        duration / 60, COUNT(1)
    FROM video
    WHERE duration > 0
    GROUP BY 1;
    """)

    result = c.fetchall()
    for item in result:
        x.append(int(item[0]))
        y.append(int(item[1]))

    pplt.plot(x, y)
    pplt.xlim(0, 120)
    pplt.xlabel("Video Length (Unit: Minute)")
    pplt.ylabel("Video Count")
    pplt.title("Video Length Distribution")
    pplt.legend()


def main():

    pplt.figure(figsize=(12, 6))
    pplt.rcParams['font.sans-serif']=['SimHei']

    pplt.subplot(2, 1, 1)
    plot_yearly_data()

    pplt.subplot(2, 1, 2)
    plot_watch_hour()

    pplt.subplots_adjust(wspace=0.2, hspace=0.8)
    filepath = os.path.join(os.path.dirname(__file__), "plot", "graghs_one.svg")
    pplt.savefig(filepath, format="svg")
    pplt.clf()

    pplt.subplot(1, 1, 1)
    plot_top_five()
    filepath = os.path.join(os.path.dirname(__file__), "plot", "graghs_two.svg")
    pplt.savefig(filepath, format="svg")
    pplt.clf()

    pplt.subplot(1, 1, 1)
    plot_video_length()

    filepath = os.path.join(os.path.dirname(__file__), "plot", "graghs_three.svg")
    pplt.savefig(filepath, format="svg")

    db_conn.commit()
    db_conn.close()

if __name__ == "__main__":
    main()
可视化图表展示及分析
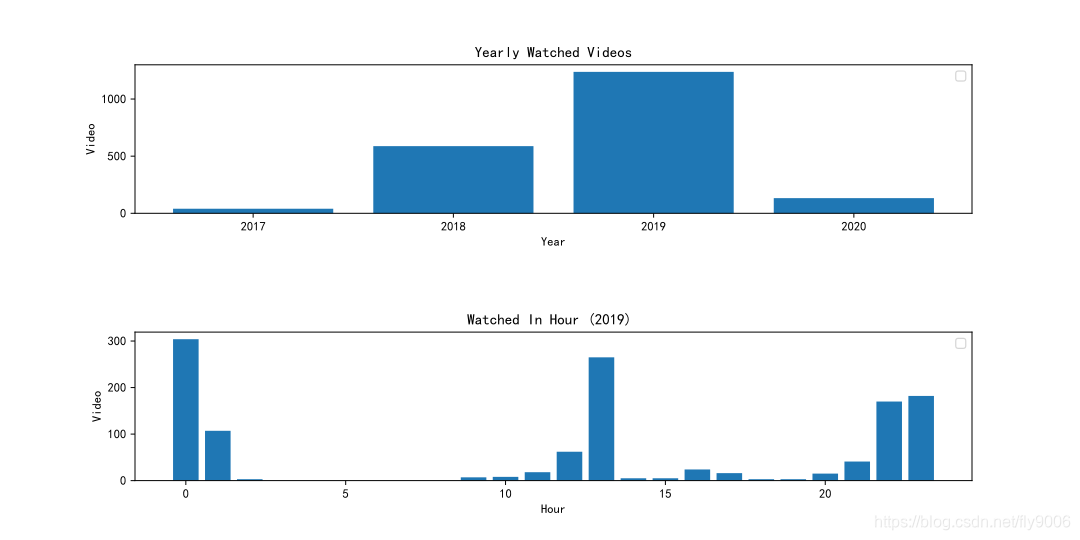
图二数据可以看出,每天的观看时间主要集中分布在三个时间段。中午13点左右是因为上班的午休时间,吃完饭准备午睡前总会喜欢看上几部视频。另外一个比较突出的是晚上12点时间段,侧面可以看出自己的作息时间还算是比较晚的,希望在未来的一年在作息习惯上自己能有所改善。
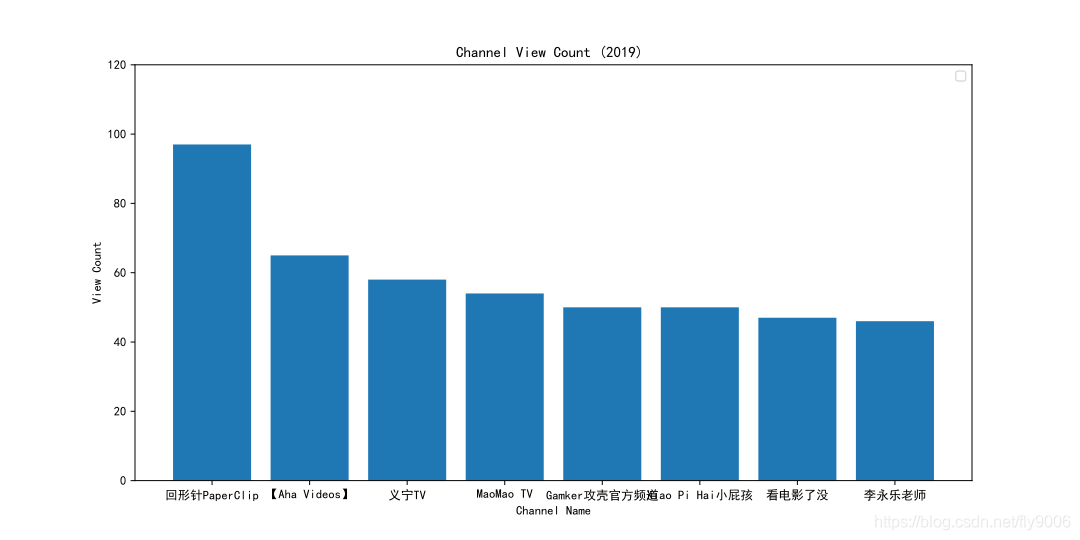
图三为观看油管视频以来观看数量排前八的channel,大致涵盖了科普、潮流、游戏、电影这几个内容领域,这个名单大致能体现最近一段时间我比较感兴趣的不同内容领域的channel。
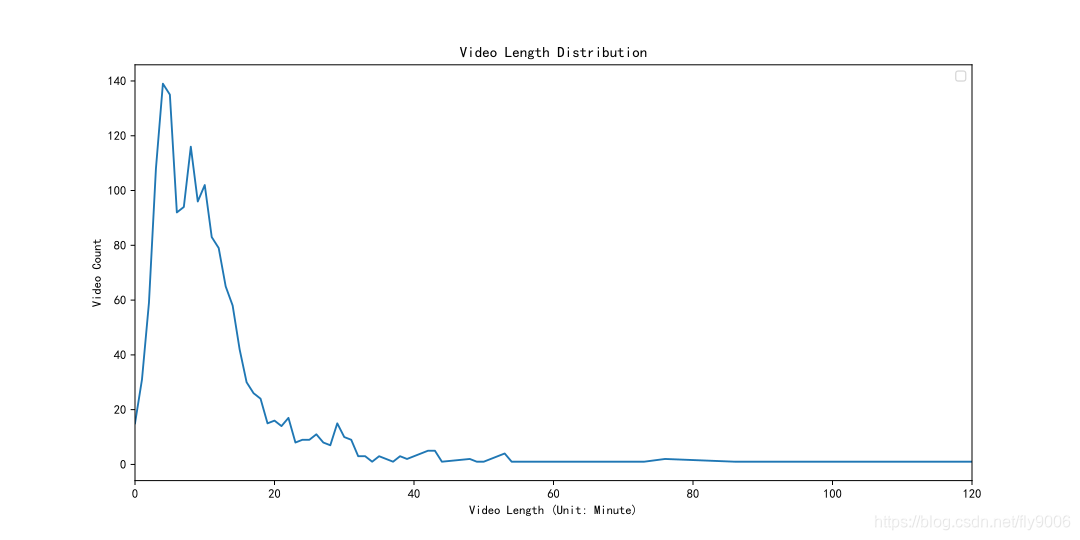
图四可以看出观看过的视频大部分分布在20分钟以下,其中10分钟长度左右的视频数量占比最大。
总结
相比国内那些发展还未成熟的视频平台,油管能让我汲取到更多有价值的知识,获取到更多有用的资讯,所以未来我还会一直保持使用油管的习惯;
这次搜集到的数据其实还能用来做更多其他有趣的维度分析,例如看过的视频标签分布情况、视频热度分布情况、点赞最多的视频名单、dislike最多的视频名单等等。这次先点到为止,留些TODO下次来完成;