iOS程序内存泄露的检测
# 前言Instruments是一个灵活又强大的工具,它可以让开发者跟踪一个或者多个进程,并检测收集的实时数据,使开发者更好地理解应用程序和操作系统的行为和性能。 本文将演示如何使用Instruments中的Allocation和Leaks工具,进行分析和修复应用程序中内存泄露的问题。 本文用OC语言来制造内存泄露案例
Allocation工具
Instruments中的Allocation工具,可以显示内存中的对象占用曲线,内存当前分配给了哪些对象,被分配内存的对象数量,以及由哪些函数进行对象的创建。因此我们可以使用这些信息,识别应用程序中的内存分配状况,从而定位应用程序内存效率低下的地方。
使用步骤
1.制造内存泄露
创建两个类:Person、Dog,让他们之间互相强引用。代码如下(示例):
Person.h
#import <Foundation/Foundation.h>
#import "Dog.h"
NS_ASSUME_NONNULL_BEGIN

@class Dog;

@interface Person : NSObject

@property (nonatomic, strong)NSString *name;
@property (nonatomic, strong)Dog *dog;
@end

NS_ASSUME_NONNULL_END
Person.m
#import "Person.h"
#import <objc/runtime.h>

@implementation Person

- (instancetype)init
{
    self = [super init];
    if (self) {
        NSLog(@"Person对象创建,地址:%p",&self);
    }
    return self;
}

- (void)dealloc
{
    NSLog(@"Person对象销毁");
}
@end
Dog.h
#import <Foundation/Foundation.h>
#import "Person.h"

NS_ASSUME_NONNULL_BEGIN

@class Person;

@interface Dog : NSObject

@property (nonatomic, strong) NSString *name;
@property (nonatomic, strong) Person *master;
@end

NS_ASSUME_NONNULL_END
Dog.m
#import "Dog.h"

@implementation Dog

- (instancetype)init
{
    self = [super init];
    if (self) {
        NSLog(@"Dog对象创建,地址:%p",&self);
    }
    return self;
}

- (void)dealloc
{
    NSLog(@"Dog对象销毁");
}
@end
ViewController.m
#import "ViewController.h"
#import "Person.h"
#import "Dog.h"

@interface ViewController ()

@end

@implementation ViewController

- (void)viewDidLoad {
    [super viewDidLoad];
    // Do any additional setup after loading the view.


}

- (void)touchesBegan:(NSSet<UITouch *> *)touches withEvent:(UIEvent *)event{

    Person *person = [[Person alloc] init];
    person.name = @"小丁";

    Dog *dog = [[Dog alloc] init];
    dog.name = @"黑豹";
    //关键在下面两行代码,互相强引用
    person.dog = dog;
    dog.master = person;

    dog = nil;
    person = nil;

}

@end
2.使用Allocations工具进行内存检测
入口:【Product > Profile】
窗口中列出了所有的instrument工具,选择Allocation,点击左上角的红点按钮开始检测应用程序,点击屏幕触发touchesBegan方法,然后搜索Person对象,果然如下图所示,定位到了内存泄露有关的代码信息。

你以为到这里就结束了吗?不,还没有!现在我们来改一下touchesBegan方法
- (void)touchesBegan:(NSSet<UITouch *> *)touches withEvent:(UIEvent *)event{

    Person *person = [[Person alloc] init];
    person.name = @"小丁";

    Dog *dog = [[Dog alloc] init];
    dog.name = @"黑豹";

    person.dog = dog;
    dog.master = person;

    dog = nil;
    person = nil;
    //添加可以正常释放的几个对象
    Person *person1 = [[Person alloc] init];
    Person *person2 = [[Person alloc] init];
    Dog *dog1 = [[Dog alloc] init];
    Dog *dog2 = [[Dog alloc] init];
    dog1 = nil;
    dog2 = nil;
    person1 = nil;
    person2 = nil;
}
然后我们再回到Allocation中,修改两个选项: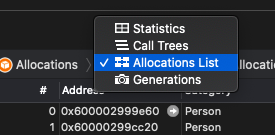

修改完毕继续调试应用程序
我们发现几个live栏中没有小黑点的对象,说明这些对象已经成功从内存中清除,还记得我们再delloc方法中添加的代码吗?没错,它成功在日志中输出了。如下图
好的,到此我们Allocation用法就结束了
总结
虽然说良好的编程习惯可以杜绝大部分的内存泄露,但是当iOS加入了ARC机制,相互引用关系比较复杂时,内存泄露还是可能存在的,因此学会利用这些简单有效的工具来进行检测,有助于我们开发更加稳定和安全的应用程序。
参考文献:《iOS移动开发从入门到精通》
版权声明:本文为qq_41431582原创文章,遵循CC 4.0 BY-SA版权协议,转载请附上原文出处链接和本声明。