1.Image模块
#图像的读入、显示、保存
from PIL import Image
a=Image.open('cat.jpg')  #读入图像
a.show()  #显示图片
print(a.mode,a.size,a.format)   #显示图像信息(颜色模式,图像大小,图像原格式)
a.save("cat.png")  #另存为
运行结果:
RGB (400, 460) JPEG
2.#创建新图像文件
#创建新图像文件
from PIL import Image
a=Image.new("RGB",(640,480),(78,190,186))   #创建新图像     (78,190,186)是湖绿色的RGB
a.save("figure20.7.jpg")  #另存为图像
a.show()  #显示图像
运行结果:
3.改变图像大小和模式
#改变图像大小和模式
from PIL import Image
from pylab import subplot,imshow,show
a=Image.open('cat.jpg')   #读入图像
b=a.resize((128,128))   #改变图像尺寸
c=b.convert('CMYK')  #转换为CMYK模式
d=b.convert('L')   #灰度模式
subplot(131);imshow(b)
subplot(132);imshow(c)
subplot(133);imshow(d)
show()
运行结果:
4.图像的分隔与合并
#图像的分割与合并
from PIL import Image
from pylab import subplot,imshow,show
a=Image.open('cat.jpg')  #读入图像
ra,ga,ba=a.split()  #把图像分割为R,G,B三个通道图像
c=Image.merge('RGB',(ra,ga,ba)) #三个通道合成一张彩色图像
subplot(221);imshow(ra)
subplot(222);imshow(ga)
subplot(223);imshow(ba)
subplot(224);imshow(c)
show()
运行结果:
5.图像的粘贴
#图像的粘贴
from PIL import Image
a=Image.open('cat.jpg')  #读入图像
b=Image.open('fish.png')

print(a.size,b.size)  #打印图像的大小

c=b.resize((50,50))#设置图像尺寸

a.paste(c,(20,20))  #粘贴图像

a.show()#显示
运行结果:
6.读取和设置指定位置的像素
#读取和设置指定位置的像素
from PIL import Image
from numpy import array
a=Image.open('cat.jpg')  #读入图像
position=(100,100)  #位置
b1=a.getpixel(position)  #读取该位置的像素
a.putpixel(position,tuple(array(b1)//2))  #修改像素    ,tuple是元组,//是数学除
print(b1,a.getpixel(position))  #打印前后的像素值
运行结果:
(255, 255, 255) (127, 127, 127)
7.线段与圆弧绘制
#线段与圆弧绘制
from PIL import Image,ImageDraw
from numpy import array

a=Image.open('cat.jpg')  #读入图像
w,h=a.size #读入图像的宽度,高度
b=ImageDraw.Draw(a)  #实例化Draw类

b.line(((0,0),(w-1,0)),fill=(255,0,0))
b.line(((w-1,0),(w-1,h-1)),fill=(255,0,0))
b.arc((0,0,w-1,h-1),0,360,fill=(255,0,0))
a.show()   #显示图像
a.save("figure20.12.jpg")  #保存图像
运行结果:
8.ImageDraw模块
from PIL import Image,ImageDraw,ImageFont
a=Image.open('cat.jpg')   #读入图像
b=ImageDraw.Draw(a)   #实例化Draw类
myfont=ImageFont.truetype("c:\\Windows\\Fonts\\simsunb.ttf",48)
b.text((20,20),"cat",font=myfont,fill=(255,0,0))
a.show()
a.save("figure20.13")
运行结果:
9.使用各种滤镜
#使用滤镜
from PIL import Image,ImageFilter
from pylab import subplot,show,imshow
a=Image.open('cat.jpg')  #读入图像
b=a.filter(ImageFilter.BLUR)   #使用模糊滤镜
c=a.filter(ImageFilter.CONTOUR)   #使用轮廓滤镜
d=a.filter(ImageFilter.EDGE_ENHANCE)   #使用边界加强滤镜
e=a.filter(ImageFilter.EMBOSS)   #使用浮雕滤镜
f=a.filter(ImageFilter.FIND_EDGES)   #使用边界滤镜
g=a.filter(ImageFilter.SMOOTH)   #使用平滑滤镜
h=a.filter(ImageFilter.SHARPEN)   #使用锐化滤镜


subplot(331);imshow(a)
subplot(332);imshow(b)
subplot(333);imshow(c)
subplot(334);imshow(d)
subplot(335);imshow(e)
subplot(336);imshow(f)
subplot(337);imshow(g)
subplot(338);imshow(h)

show()

'''
ImageFilter.BLUR	模糊滤镜
ImageFilter.CONTOUR	轮廓滤镜
ImageFilter.EDGE_ENHANCE	边界加强
ImageFilter.EDGE_ENHANCE_MORE	边界加强(阈值更大)
ImageFilter.EMBOSS	浮雕滤镜
ImageFilter.FIND_EDGES	边界滤镜
ImageFilter.SMOOTH	平滑滤镜
ImageFilter.SMOOTH_MORE	平滑滤镜(阈值更大)
ImageFilter.SHARPEN	锐化滤镜
'''
运行结果: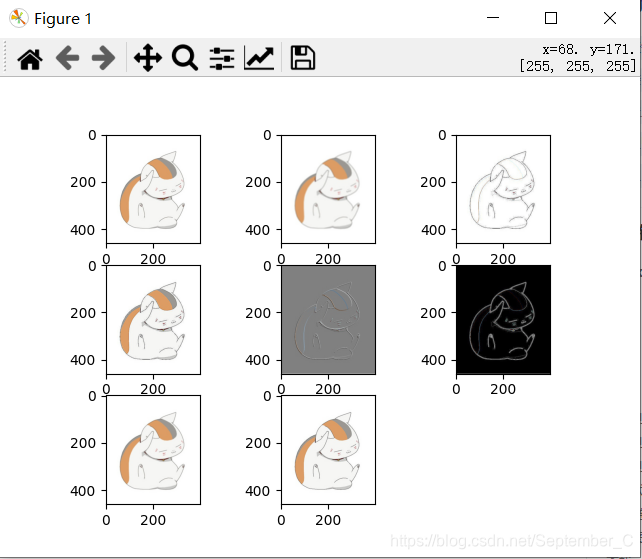
版权声明:本文为September_C原创文章,遵循CC 4.0 BY-SA版权协议,转载请附上原文出处链接和本声明。