上篇讲了圆环进度条,这里再稍微改进下,将单环改成多环。有兴趣的朋友,可以了解下。
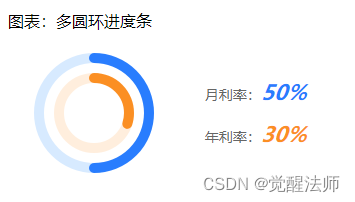
咱们将数组里增加一项,圆环会增加一个,如下图:
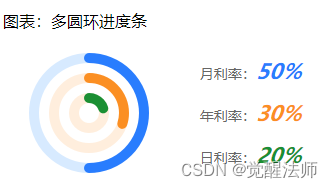
可以容纳几个圆环,大家可以根据需求进行微调。
一、创建相应页面
1.1 scss样式代码
.wrap-box{ padding: 0 30rpx;
	.echart-box{ padding: 15px 0; border-bottom: 1px solid #DDDDDD;
		.title{ font-size: 32rpx; }
		.content{ padding-top: 15rpx; font-size: 28rpx; color: #666666;
			&::after{ display: block; content: ''; clear: both; }
			.chart{ width: 300rpx; height: 300rpx; margin: 0 auto; }

			.half-box{ width: 50%; float: left; }
			.flex{ width: 300rpx; height: 300rpx; line-height: 2; display: flex; justify-content: center; align-items: center; flex-direction: column; }
			.percent{ font-weight: bold; font-size: 42rpx; font-style: oblique; }
		}
		.btn-box{ text-align: center;
			.btn{ display: inline-block; vertical-align: middle; margin: 0 20rpx; font-size: 30rpx; background-color: #297DFE; color: #fff; }
		}
	}
}
//wrap--box end
1.2 chart.js文件创建
/**
 * 图表 - 多圆环进度条
 */
export class CircleBox {
	/**
	 * 构造函数
	 * @param {Object} _context
	 */
	constructor(_context, _dataList){

	}

	//开始绘制
	drawStart(){

	}

	/**
	 * 绘制圆环
	 */
	drawCircle(_param, _i){

	}
}
1.3 vue页面
<template>
	<view class="wrap-box">
		<view class="echart-box chart01">
			<view class="title">图表:多圆环进度条</view>
			<view class="content">
				<view class="half-box left">
					<canvas canvas-id="chartBox2" id="chartBox2" class="chart"></canvas>
				</view>
				<view class="half-box right">
					<view class="flex">
						<view v-for="(item, index) in arrayList" :key="index">
							<text>{{item.name}}:</text>
							<text class="percent" :style="'color: ' + item.linePercentColor">{{item.percent*100}}%</text>
						</view>
					</view>
				</view>
			</view>

		</view>
	</view>
</template>

<script>
	import { CircleBox } from './charts.js';

	export default {
		data() {
			return {
				cbox1: null,       //画布实例对象
				arrayList: [
					{
						percent: .5,
						lineColor: '#D7EAFF',
						linePercentColor: "#297DFE",
						name: "月利率"
					},
					{
						percent: .3,
						lineColor: '#FFEEDD',
						linePercentColor: "#FB8F23",
						name: "年利率"
					},
				]
			}
		},
		mounted() {
			this.initCircle();
		},
		methods: {
			initCircle(){
				//实例对象
				this.cbox1 = new CircleBox(uni.createCanvasContext('chartBox2'), this.arrayList.map(item => item));
				//开始绘制
				this.cbox1.drawStart();
			}
		}
	}
</script>

<style lang="scss">
@import '../index.scss';
</style>
二、图表实现业务逻辑
2.1 构造函数 定义相应变量
/**
 * 构造函数
 * @param {Object} _context
 */
constructor(_context, _dataList){
	this.ctx = _context;
	//数据值
	this.dataList = Array.isArray(_dataList) ? _dataList : [];
	//直径
	this.radius = uni.upx2px(300);
	//四周内填充
	this.padding = uni.upx2px(20);
	//线宽度
	this.lineWidth = uni.upx2px(20);
}
2.2 定义drawCircle()函数
这里做了点小调整,不直接通过drawCircle进行绘制图表。由于是多环,将此函数改为递归函数。_param为每个圆环数据集,_i为第几个圆环,方便递归过程中,修改圆直径大小。
/**
 * 绘制圆环
 */
drawCircle(_param, _i){
	//计算实际半径
	let _radius = this.radius/2-((this.padding+this.lineWidth)*(_i+1));

	//开始绘制圆环
	this.ctx.beginPath();
	this.ctx.arc(this.radius/2,this.radius/2, _radius,0,Math.PI*2, false);
	this.ctx.lineWidth = this.lineWidth;
	this.ctx.strokeStyle = _param.lineColor;
	this.ctx.stroke();

	//绘制高亮进度条
	this.ctx.beginPath();
	this.ctx.lineCap = 'round';
	this.ctx.arc(this.radius/2,this.radius/2, _radius,-(Math.PI / 2), ((Math.PI * 2) * _param.percent) - Math.PI / 2, false);
	this.ctx.strokeStyle = _param.linePercentColor;
	this.ctx.stroke();
	//恢复之前保存的绘图上下文
	this.ctx.restore();
}
2.3 定义drawStart()函数
在drawStart函数中,进行循环绘制多圆环功能。
//开始绘制
drawStart(){
	//清空画面
	this.ctx.clearRect(0, 0, this.radius, this.radius);
	//循环绘制出每个圆环
	for(var i in this.dataList){
		//绘制圆环
		this.drawCircle(this.dataList[i], parseInt(i));
	}
	//绘制图形
	this.ctx.draw();
}
这时页面中实例CircleBox类后,直接调用drawStart函数,则可以绘制出图表了。
如果数组为空情况,则不会有内容绘制出来。可以判断数组为空情况,页面绘制文字内容进行提示即可,这里就不细说了。不足地方,欢迎指出。
版权声明:本文为jiciqiang原创文章,遵循CC 4.0 BY-SA版权协议,转载请附上原文出处链接和本声明。