一、后台管理基础配置
1.>python manage.py startapp host
2.设置本地化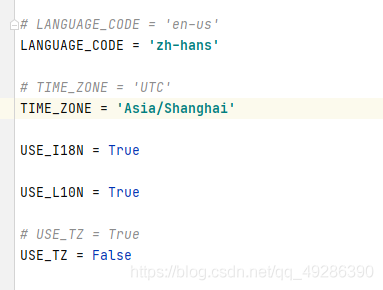
3.创建数据库表和超级用户
python manage.py makemigrations
python manage.py migrate
python manage.py createsuperuser
4.git管理项目
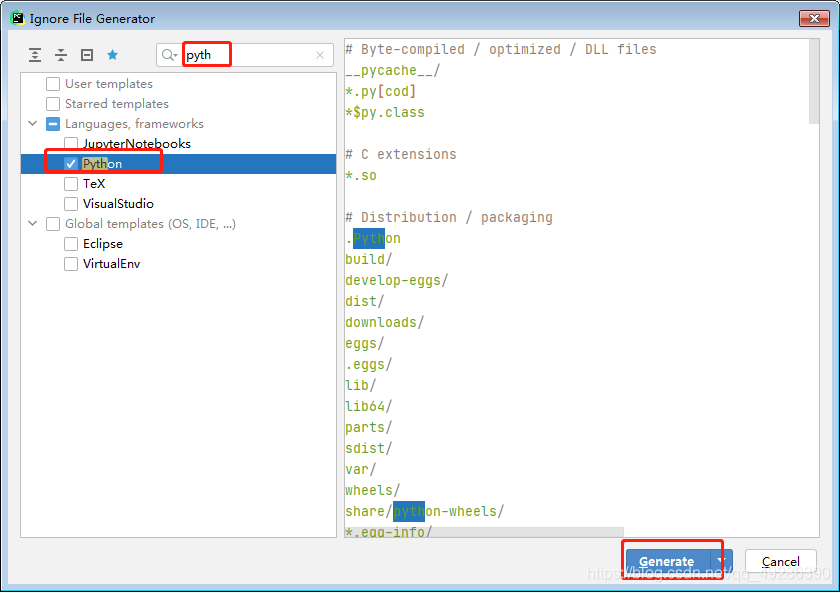
1)生成.gitignore(可忽略的文件不会被上传)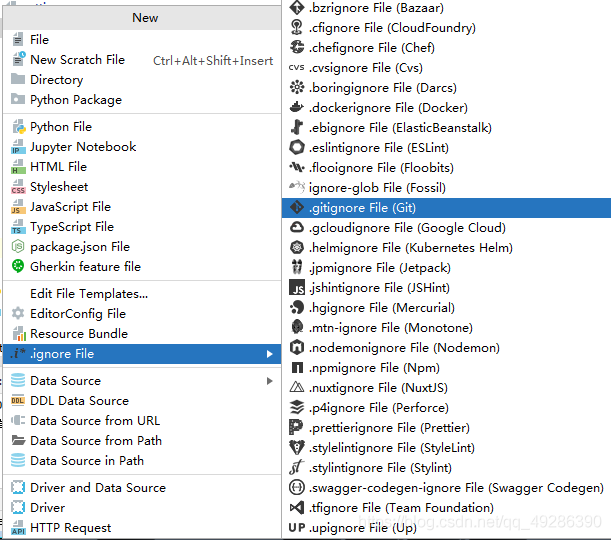
2).生成requrements.txt和README.md文件
pip freeze > requrements.txt
(pip freeze:查看自己安装的软件包)
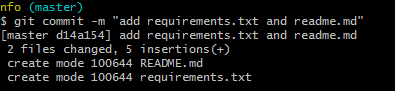
3).添加保存设置
git init
git add *
git commit -m "add requirements.txt and README.md"
5. 文件编辑
# sysinfo/urls.py
from django.contrib import admin
from django.urls import path, include

urlpatterns = [
    path('admin/', admin.site.urls),
    path('', include('host.urls'))
]
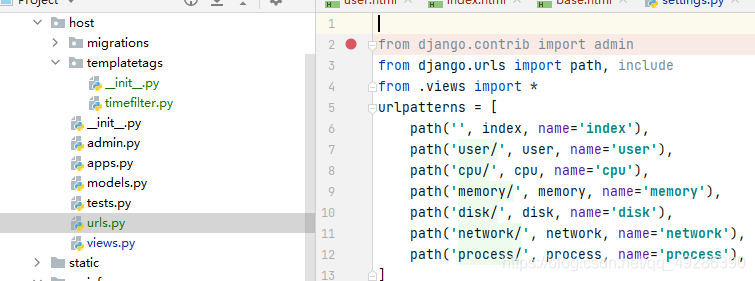
#host/urls.py
from django.contrib import admin
from django.urls import path, include
from .views import *
urlpatterns = [
    path('', index, name='index'),
    path('user/', user, name='user'),
    path('cpu/', cpu, name='cpu'),
    path('memory/', memory, name='memory'),
    path('disk/', disk, name='disk'),
    path('network/', network, name='network'),
    path('process/', process, name='process'),
]
#host/views.py
from django.shortcuts import render

# Create your views here.

def index(request):
    pass
    return  render(request, 'host/index.html', locals())

def user(request):
    pass
    return  render(request, 'host/user.html', locals())

def cpu(request):
    pass
    return  render(request, 'host/cpu.html', locals())

def memory(request):
    pass
    return  render(request, 'host/memory.html', locals())

def disk(request):
    pass
    return  render(request, 'host/disk.html', locals())

def network(request):
    pass
    return  render(request, 'host/network.html', locals())

def process(request):
    pass
    return  render(request, 'host/process.html', locals())
6.在模块下建立相应的html文件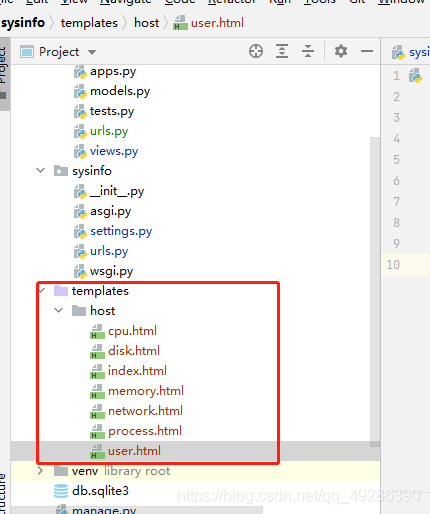
访问测试: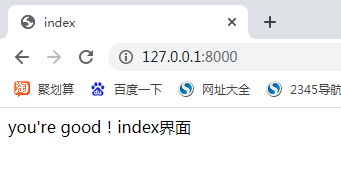
二、前端管理 首页展示(显示系统信息)
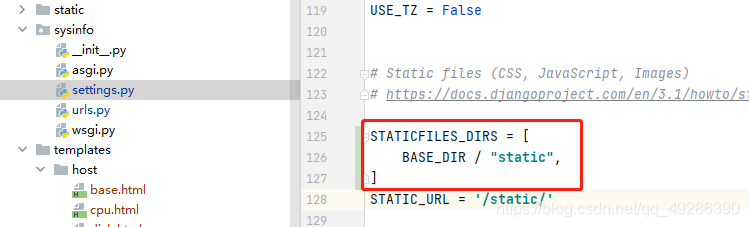
#settings.py
STATICFILES_DIRS = [
    BASE_DIR / "static",
]
#host/views.py
from datetime import datetime

from django.shortcuts import render
import  psutil
import  os, platform
# Create your views here.

def index(request):
    """
    sys_name
    kernel_name
    kernel_no
    kernel_version
    sys_framework
    now_time
    boot_time
    up_time
    """
    try:
        info = os.uname()
    except Exception as e:
        info = platform.uname()
    sys_name = info.node
    kernel_name = info.system
    kernel_no = info.release
    kernel_version = info.version
    sys_framework = info.machine
    boot_time = datetime.fromtimestamp(psutil.boot_time())
    now_time = datetime.now()
    print(boot_time, now_time)
    up_time = now_time - boot_time

    return  render(request, 'host/index.html', locals())

def user(request):
    pass
    return  render(request, 'host/user.html', locals())

def cpu(request):
    pass
    return  render(request, 'host/cpu.html', locals())

def memory(request):
    pass
    return  render(request, 'host/memory.html', locals())

def disk(request):
    pass
    return  render(request, 'host/disk.html', locals())

def network(request):
    pass
    return  render(request, 'host/network.html', locals())

def process(request):
    pass
    return  render(request, 'host/process.html', locals())
并导入此目录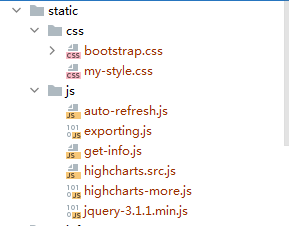
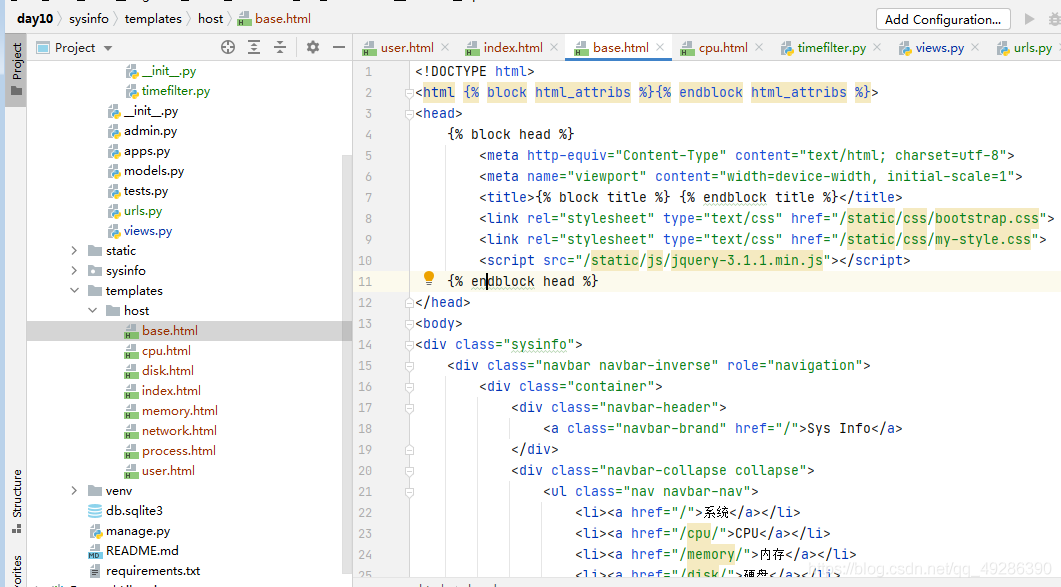
#base.html
<!DOCTYPE html>
<html {% block html_attribs %}{% endblock html_attribs %}>
<head>
    {% block head %}
        <meta http-equiv="Content-Type" content="text/html; charset=utf-8">
        <meta name="viewport" content="width=device-width, initial-scale=1">
        <title>{% block title %} {% endblock title %}</title>
        <link rel="stylesheet" type="text/css" href="/static/css/bootstrap.css">
        <link rel="stylesheet" type="text/css" href="/static/css/my-style.css">
        <script src="/static/js/jquery-3.1.1.min.js"></script>
    {% endblock head %}
</head>
<body>
<div class="sysinfo">
    <div class="navbar navbar-inverse" role="navigation">
        <div class="container">
            <div class="navbar-header">
                <a class="navbar-brand" href="/">Sys Info</a>
            </div>
            <div class="navbar-collapse collapse">
                <ul class="nav navbar-nav">
                    <li><a href="/">系统</a></li>
                    <li><a href="/cpu/">CPU</a></li>
                    <li><a href="/memory/">内存</a></li>
                    <li><a href="/disk/">硬盘</a></li>
                    <li><a href="/network/">网络</a></li>
                    <li><a href="/process/">进程</a></li>
                    <li><a href="/user/">用户</a></li>
                </ul>
            </div>
        </div>
    </div>
    <div class="container">
        {% block content %}{% endblock %}
    </div>
</div>
</body>
</html>
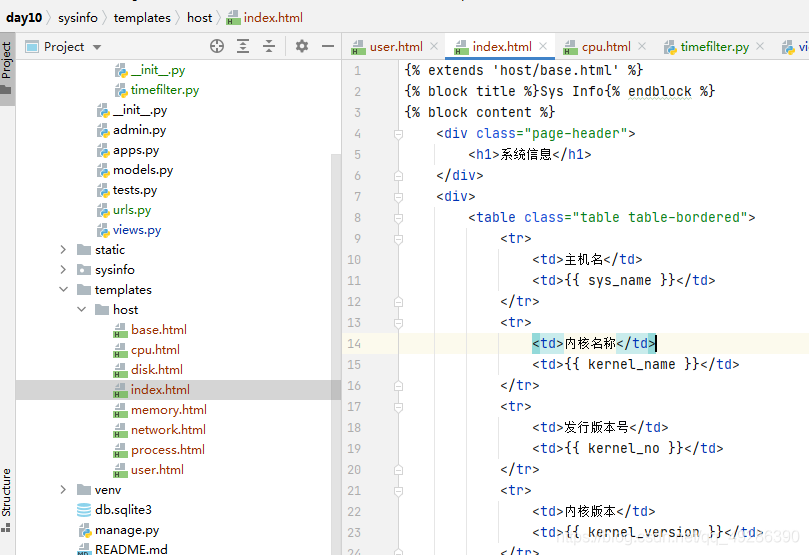
#index.html
{% extends 'host/base.html' %}
{% block title %}Sys Info{% endblock %}
{% block content %}
    <div class="page-header">
        <h1>系统信息</h1>
    </div>
    <div>
        <table class="table table-bordered">
            <tr>
                <td>主机名</td>
                <td>{{ sys_name }}</td>
            </tr>
            <tr>
                <td>内核名称</td>
                <td>{{ kernel_name }}</td>
            </tr>
            <tr>
                <td>发行版本号</td>
                <td>{{ kernel_no }}</td>
            </tr>
            <tr>
                <td>内核版本</td>
                <td>{{ kernel_version }}</td>
            </tr>
            <tr>
                <td>系统架构</td>
                <td>{{ sys_framework }}</td>
            </tr>
            <tr>
                <td>现在时间</td>
                <td>{{ now_time }}</td>
            </tr>
            <tr>
                <td>开机时间</td>
                <td>{{ boot_time }}</td>
            </tr>
            <tr>
                <td>运行时间</td>
                <td>{{ up_time }}</td>
            </tr>
        </table>
    </div>
{% endblock %}
访问测试: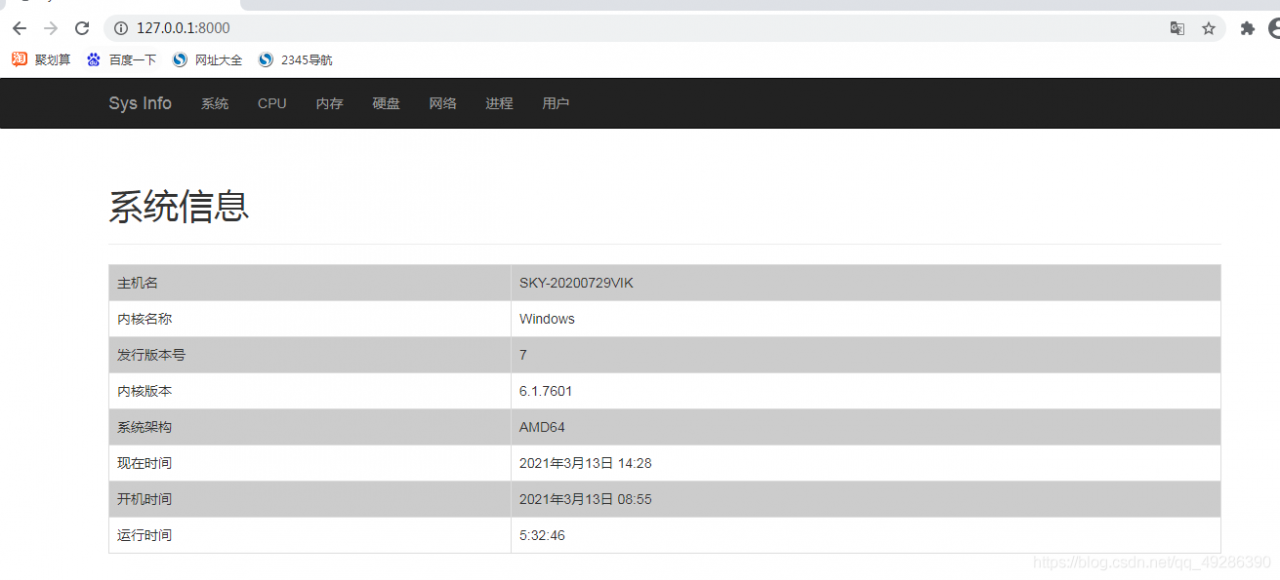
三、用户页面的前后端设置(自定义过滤器)
#host/views.py
def user(request):
    users = psutil.users()
    return  render(request, 'host/user.html', locals())
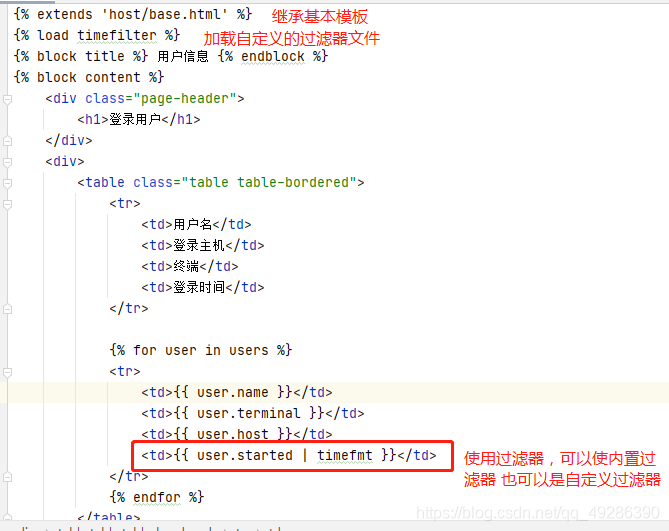
#user.html
{% extends 'host/base.html' %}
{% load timefilter %}
{% block title %} 用户信息 {% endblock %}
{% block content %}
    <div class="page-header">
        <h1>登录用户</h1>
    </div>
    <div>
        <table class="table table-bordered">
            <tr>
                <td>用户名</td>
                <td>登录主机</td>
                <td>终端</td>
                <td>登录时间</td>
            </tr>

            {% for user in users %}
            <tr>
                <td>{{ user.name }}</td>
                <td>{{ user.terminal }}</td>
                <td>{{ user.host }}</td>
                <td>{{ user.started | timefmt }}</td>
            </tr>
            {% endfor %}
        </table>
    </div>

{% endblock %}
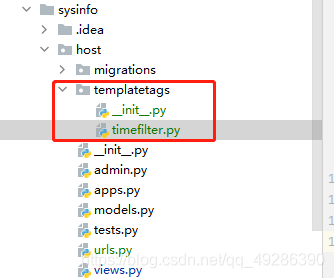
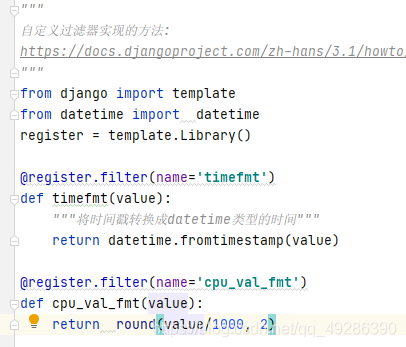
#timefilter.py
"""
自定义过滤器实现的方法:
https://docs.djangoproject.com/zh-hans/3.1/howto/custom-template-tags/
"""
from django import template
from datetime import  datetime
register = template.Library()

@register.filter(name='timefmt')
def timefmt(value):
    """将时间戳转换成datetime类型的时间"""
    return datetime.fromtimestamp(value)
访问测试:(重新启动下在运行)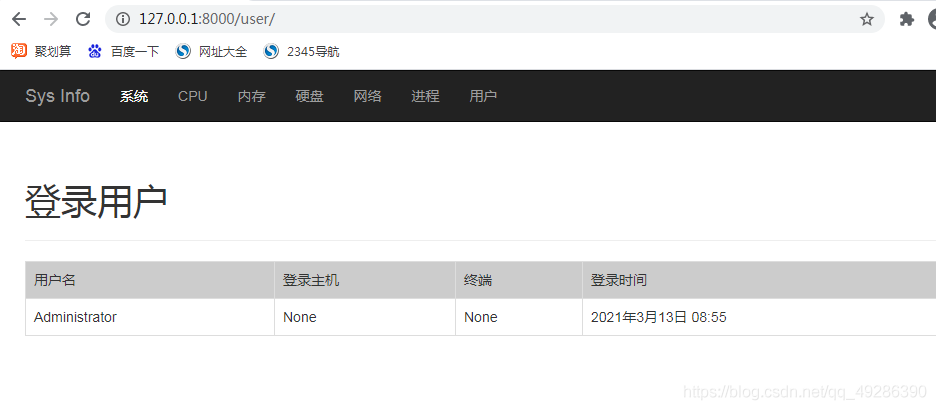
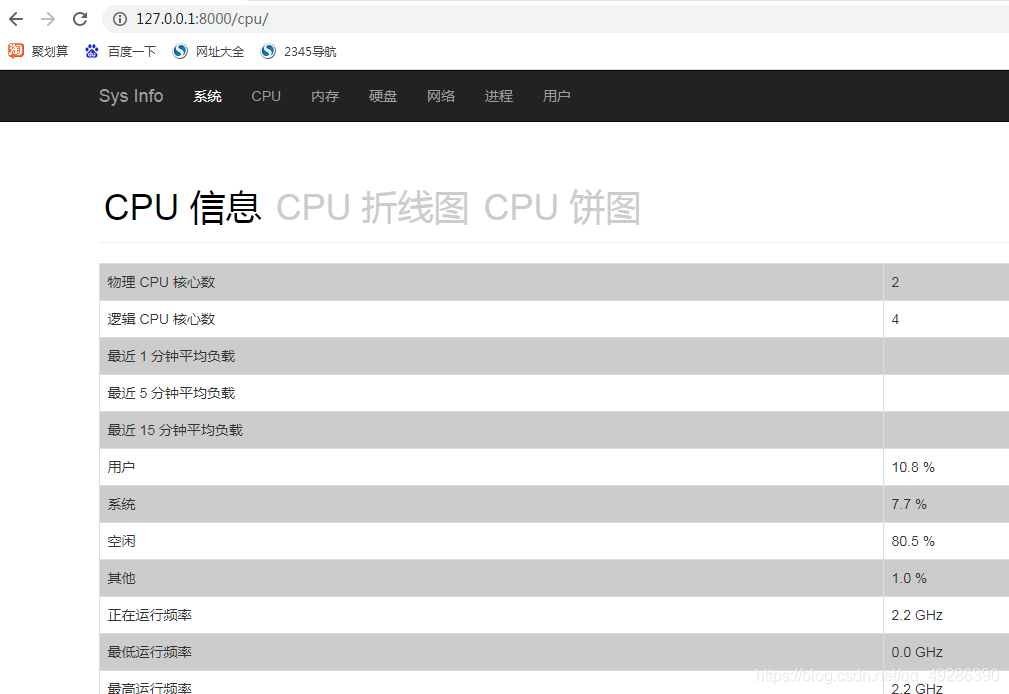
四、CPU页面的前后端设置(基于echarts的图形展示)
#host/views.py
from datetime import datetime
from django.shortcuts import render
import psutil
import os, platform
# Create your views here.
def index(request):
"""
sys_name
kernel_name
kernel_no
kernel_version
sys_framework
now_time
boot_time
up_time
"""
try:
info = os.uname()
except Exception as e:
info = platform.uname()
sys_name = info.node
kernel_name = info.system
kernel_no = info.release
kernel_version = info.version
sys_framework = info.machine
boot_time = datetime.fromtimestamp(psutil.boot_time())
now_time = datetime.now()
print(boot_time, now_time)
up_time = now_time - boot_time
return render(request, 'host/index.html', locals())
def user(request):
users = psutil.users()
return render(request, 'host/user.html', locals())
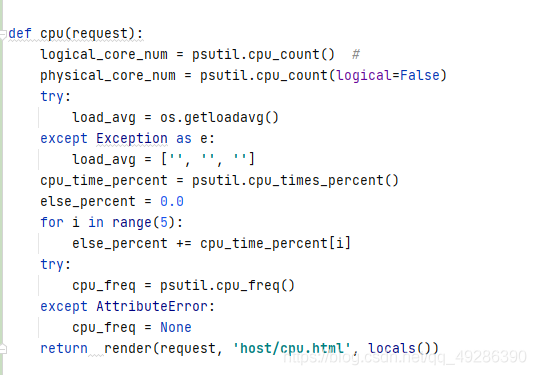
def cpu(request):
logical_core_num = psutil.cpu_count() #
physical_core_num = psutil.cpu_count(logical=False)
try:
load_avg = os.getloadavg()
except Exception as e:
load_avg = ['', '', '']
cpu_time_percent = psutil.cpu_times_percent()
else_percent = 0.0
for i in range(5):
else_percent += cpu_time_percent[i]
try:
cpu_freq = psutil.cpu_freq()
except AttributeError:
cpu_freq = None
return render(request, 'host/cpu.html', locals())
def memory(request):
pass
return render(request, 'host/memory.html', locals())
def disk(request):
pass
return render(request, 'host/disk.html', locals())
def network(request):
pass
return render(request, 'host/network.html', locals())
def process(request):
pass
return render(request, 'host/process.html', locals())
#host/templatetags/timefilter.py
@register.filter(name='cpu_val_fmt')
def cpu_val_fmt(value):
    return  round(value/1000, 2)
#cpu.html
{% extends 'host/base.html' %}
{% load timefilter %}
{% block title %} cpu信息 {% endblock %}
{% block content %}
    <div class="page-header">
        <a {% if not chart %}id="display"{% endif %} href="/cpu/">CPU 信息</a>
        <a {% if chart == 'line' %}id="display"{% endif %} href="/cpu/">CPU
            折线图</a>
        <a {% if chart == 'pie' %}id="display"{% endif %} href="/cpu/">CPU 饼图</a>
    </div>
    <div>
        <div id="cpu_info">
             <table class="table table-bordered">
            <tr>
                <td>物理 CPU 核心数</td>
                <td>{{ physical_core_num }}</td>
            </tr>
            <tr>
                <td>逻辑 CPU 核心数</td>
                <td>{{ logical_core_num }}</td>
            </tr>
            <tr>
                <td>最近 1 分钟平均负载</td>
                <td>{{ load_avg.0 }}</td>
            </tr>
            <tr>
                <td>最近 5 分钟平均负载</td>
                <td>{{ load_avg.1 }}</td>
            </tr>
            <tr>
                <td>最近 15 分钟平均负载</td>
                <td>{{ load_avg.2 }}</td>
            </tr>
            <tr>
                <td>用户</td>
                <td>{{ cpu_time_percent.user }} %</td>
            </tr>
            <tr>
                <td>系统</td>
                <td>{{ cpu_time_percent.system }} %</td>
            </tr>
            <tr>
                <td>空闲</td>
                <td>{{ cpu_time_percent.idle }} %</td>
            </tr>
            {% if cpu_time_percent.nice %}
                <tr>
                    <td>nice</td>
                    <td>{{ cpu_time_percent.nice }} %</td>
                </tr>
            {% endif %}
            {% if cpu_time_percent.iowait %}
                <tr>
                    <td>iowait</td>
                    <td>{{ cpu_time_percent.iowait }} %</td>
                </tr>
            {% endif %}
            {% if else_percent %}
                <tr>
                    <td>其他</td>
                    <td>{{ else_percent }} %</td>
                </tr>
            {% endif %}
            {% if cpu_freq %}
                <tr>
                    <td>正在运行频率</td>
                    <td>{{ cpu_freq.current | cpu_val_fmt }} GHz</td>
                </tr>
                <tr>
                    <td>最低运行频率</td>
                    <td>{{ cpu_freq.min | cpu_val_fmt }} GHz</td>
                </tr>
                <tr>
                    <td>最高运行频率</td>
                    <td>{{ cpu_freq.max | cpu_val_fmt }} GHz</td>
                </tr>
            {% endif %}
        </table>
        </div>

{% endblock %}
访问测试: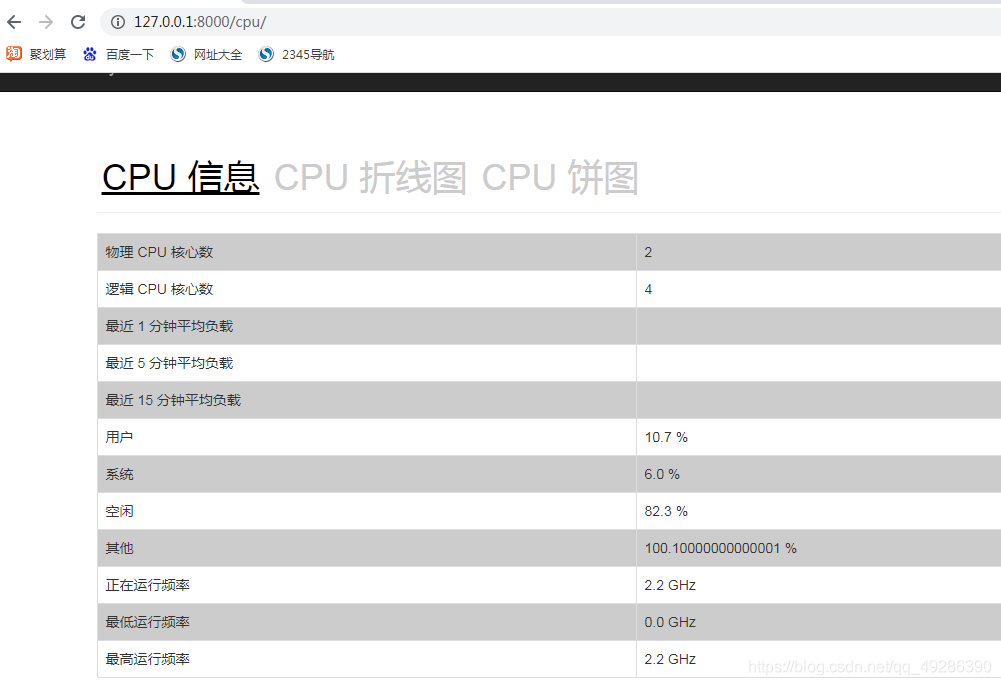
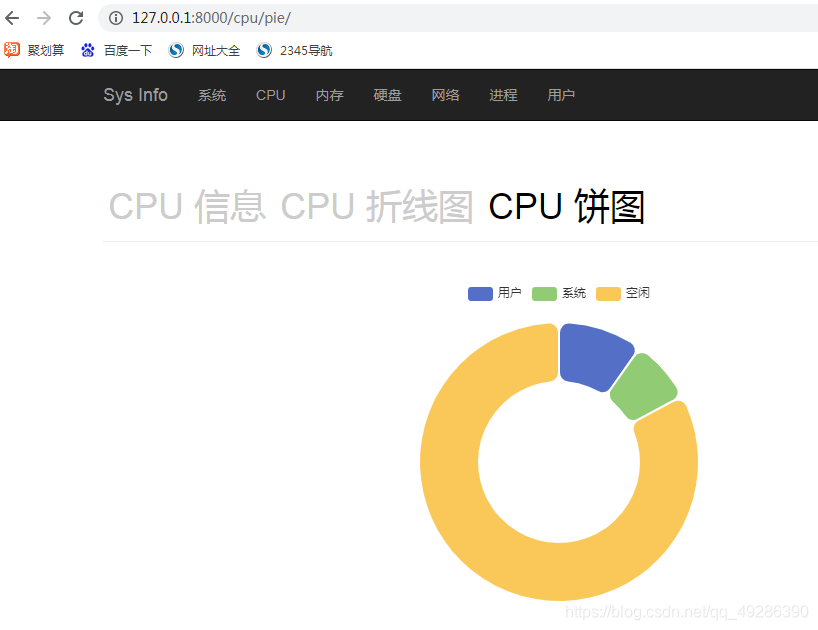
2.基于echarts的扇形图展示(以及一些细节操作)
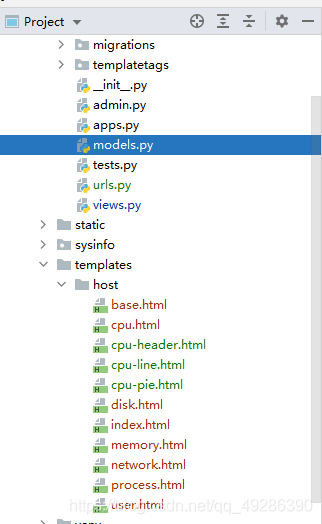
#host/models.py
from django.db import models

# Create your models here.

# 定时任务定期扫描并存储。
class UserCpuPercent(models.Model):
    create_time = models.DateTimeField(auto_now_add=True, verbose_name="扫描时间")
    user_percent = models.FloatField(verbose_name="用户CPU占用百分比")
#host/urls
from django.contrib import admin
from django.urls import path, include
from .views import *
urlpatterns = [
    path('', index, name='index'),
    path('user/', user, name='user'),
    path('cpu/', cpu, name='cpu'),
    path('cpu/<str:chart>/', cpu, name='cpu'),
    path('memory/', memory, name='memory'),
    path('disk/', disk, name='disk'),
    path('network/', network, name='network'),
    path('process/', process, name='process'),
]
#host/views.py
from datetime import datetime

from django.shortcuts import render
import psutil
import os, platform


# Create your views here.

def index(request):
    try:
        info = os.uname()
    except Exception as e:
        info = platform.uname()
    sys_name = info.node
    kernel_name = info.system
    kernel_no = info.release
    kernel_version = info.version
    sys_framework = info.machine
    boot_time = datetime.fromtimestamp(psutil.boot_time())
    now_time = datetime.now()
    print(boot_time, now_time)
    up_time = now_time - boot_time

    return render(request, 'host/index.html', locals())


def user(request):
    users = psutil.users()
    return render(request, 'host/user.html', locals())


def cpu(request, chart=None):

    logical_core_num = psutil.cpu_count()  #
    physical_core_num = psutil.cpu_count(logical=False)
    try:
        load_avg = os.getloadavg()
    except Exception as e:
        load_avg = ['', '', '']
    cpu_time_percent = psutil.cpu_times_percent()
    else_percent = 0.0
    for i in range(3, 5):
        else_percent += cpu_time_percent[i]
    try:
        cpu_freq = psutil.cpu_freq()
    except AttributeError:
        cpu_freq = None
    if chart == 'line':
        return render(request, 'host/cpu-line.html', locals())
    elif chart == 'pie':
        return render(request, 'host/cpu-pie.html', locals())
    return render(request, 'host/cpu.html', locals())


def memory(request):
    pass
    return render(request, 'host/memory.html', locals())


def disk(request):
    pass
    return render(request, 'host/disk.html', locals())


def network(request):
    pass
    return render(request, 'host/network.html', locals())


def process(request):
    pass
    return render(request, 'host/process.html', locals())
#base.html
<!DOCTYPE html>
<html {% block html_attribs %}{% endblock html_attribs %}>
<head>
    {% block head %}
        <meta http-equiv="Content-Type" content="text/html; charset=utf-8">
        <meta name="viewport" content="width=device-width, initial-scale=1">
        <title>{% block title %} {% endblock title %}</title>
        <link rel="stylesheet" type="text/css" href="/static/css/bootstrap.css">
        <link rel="stylesheet" type="text/css" href="/static/css/my-style.css">
        <script src="/static/js/jquery-3.1.1.min.js"></script>
        <script src="https://lib.baomitu.com/echarts/5.0.2/echarts.min.js"></script>
    {% endblock head %}
</head>
<body>
<div class="sysinfo">
    <div class="navbar navbar-inverse" role="navigation">
        <div class="container">
            <div class="navbar-header">
                <a class="navbar-brand" href="/">Sys Info</a>
            </div>
            <div class="navbar-collapse collapse">
                <ul class="nav navbar-nav">
                    <li><a href="/">系统</a></li>
                    <li><a href="/cpu/">CPU</a></li>
                    <li><a href="/memory/">内存</a></li>
                    <li><a href="/disk/">硬盘</a></li>
                    <li><a href="/network/">网络</a></li>
                    <li><a href="/process/">进程</a></li>
                    <li><a href="/user/">用户</a></li>
                </ul>
            </div>
        </div>
    </div>
    <div class="container">
        {% block content %}{% endblock %}
    </div>
</div>
</body>
</html>
#cpu.html
{% extends 'host/base.html' %}
{% load timefilter %}
{% block title %} cpu信息 {% endblock %}
{% block content %}
    {% include 'host/cpu-header.html' %}
    <div>
        <div id="cpu_info">
             <table class="table table-bordered">
            <tr>
                <td>物理 CPU 核心数</td>
                <td>{{ physical_core_num }}</td>
            </tr>
            <tr>
                <td>逻辑 CPU 核心数</td>
                <td>{{ logical_core_num }}</td>
            </tr>
            <tr>
                <td>最近 1 分钟平均负载</td>
                <td>{{ load_avg.0 }}</td>
            </tr>
            <tr>
                <td>最近 5 分钟平均负载</td>
                <td>{{ load_avg.1 }}</td>
            </tr>
            <tr>
                <td>最近 15 分钟平均负载</td>
                <td>{{ load_avg.2 }}</td>
            </tr>
            <tr>
                <td>用户</td>
                <td>{{ cpu_time_percent.user }} %</td>
            </tr>
            <tr>
                <td>系统</td>
                <td>{{ cpu_time_percent.system }} %</td>
            </tr>
            <tr>
                <td>空闲</td>
                <td>{{ cpu_time_percent.idle }} %</td>
            </tr>
            {% if cpu_time_percent.nice %}
                <tr>
                    <td>nice</td>
                    <td>{{ cpu_time_percent.nice }} %</td>
                </tr>
            {% endif %}
            {% if cpu_time_percent.iowait %}
                <tr>
                    <td>iowait</td>
                    <td>{{ cpu_time_percent.iowait }} %</td>
                </tr>
            {% endif %}
            {% if else_percent %}
                <tr>
                    <td>其他</td>
                    <td>{{ else_percent }} %</td>
                </tr>
            {% endif %}
            {% if cpu_freq %}
                <tr>
                    <td>正在运行频率</td>
                    <td>{{ cpu_freq.current | cpu_val_fmt }} GHz</td>
                </tr>
                <tr>
                    <td>最低运行频率</td>
                    <td>{{ cpu_freq.min | cpu_val_fmt }} GHz</td>
                </tr>
                <tr>
                    <td>最高运行频率</td>
                    <td>{{ cpu_freq.max | cpu_val_fmt }} GHz</td>
                </tr>
            {% endif %}
        </table>
        </div>
    </div>

{% endblock %}
#cpu-header.html
<div class="page-header">
    <a {% if not chart %}id="display"{% endif %} href="/cpu/">CPU 信息</a>
    <a {% if chart == 'line' %}id="display"{% endif %} href="/cpu/line/">CPU
        折线图</a>
    <a {% if chart == 'pie' %}id="display"{% endif %} href="/cpu/pie/">CPU 饼图</a>
</div>
#cpu-line.html
{% extends 'host/base.html' %}
{% load timefilter %}
{% block title %} cpu信息 {% endblock %}
{% block content %}
        {% include 'host/cpu-header.html' %}
    <div>
        <div id="main" style="width: 80%;height:400px;"></div>
    </div>

    <script type="text/javascript">
        // 基于准备好的dom,初始化echarts实例
        var myChart = echarts.init(document.getElementById('main'));

        option = {
            xAxis: {
                type: 'category',
                data: ['Mon', 'Tue', 'Wed', 'Thu', 'Fri', 'Sat', 'Sun']
            },
            yAxis: {
                type: 'value'
            },
            series: [{
                data: [820, 932, 901, 934, 1290, 1330, 1320],
                type: 'line',
                smooth: true
            }]
        };

        // 使用刚指定的配置项和数据显示图表。
        myChart.setOption(option);
    </script>

{% endblock %}
#cpu-pie.html
{% extends 'host/base.html' %}
{% load timefilter %}
{% block title %} cpu信息 {% endblock %}
{% block content %}
    {% include 'host/cpu-header.html' %}
    <div>
        <div id="main" style="width: 80%;height:400px;"></div>
    </div>
    <script type="text/javascript">
        // 基于准备好的dom,初始化echarts实例
        var myChart = echarts.init(document.getElementById('main'));

        option = {
            tooltip: {
                trigger: 'item'
            },
            legend: {
                top: '5%',
                left: 'center'
            },
            series: [
                {
                    name: 'CPU占用百分比分类',
                    type: 'pie',
                    radius: ['40%', '70%'],
                    avoidLabelOverlap: false,
                    itemStyle: {
                        borderRadius: 10,
                        borderColor: '#fff',
                        borderWidth: 2
                    },
                    label: {
                        show: false,
                        position: 'center'
                    },
                    emphasis: {
                        label: {
                            show: true,
                            fontSize: '40',
                            fontWeight: 'bold'
                        }
                    },
                    labelLine: {
                        show: false
                    },
                    data: [
                        {value: {{ cpu_time_percent.user }}, name: '用户'},
                        {value: {{ cpu_time_percent.system }}, name: '系统'},
                        {value: {{ cpu_time_percent.idle }}, name: '空闲'},

                    ]
                }
            ]
        };

        // 使用刚指定的配置项和数据显示图表。
        myChart.setOption(option);
    </script>
{% endblock %}
生成数据库迁移脚本并导入到数据库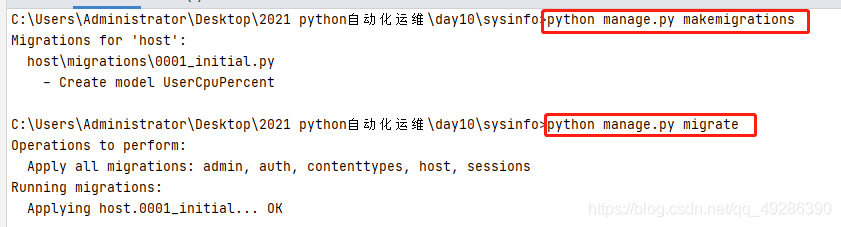
访问测试:
- get
版权声明:本文为qq_49286390原创文章,遵循CC 4.0 BY-SA版权协议,转载请附上原文出处链接和本声明。