1.下载nginx压缩包
wget http://nginx.org/download/nginx-1.18.0.tar.gz
2.下载好解压到目录/opt/,并把文件夹重命名为nginx
tar zxvf nginx-1.18.0.tar.gz -C /opt/ && mv /opt/nginx/nginx-1.18.0 /opt/nginx/nginx
3.进入nginx目录后编译安装(注:一定要加上参数--with-http_stub_status_module),如果编译时报错make: *** No rule to make target `build', needed by `default'. Stop,则先安装先关的库
yum -y install make zlib-devel gcc-c++ libtool openssl openssl-devel后,重新编译
cd /opt/nginx/
./configure --with-http_stub_status_module
make && make install
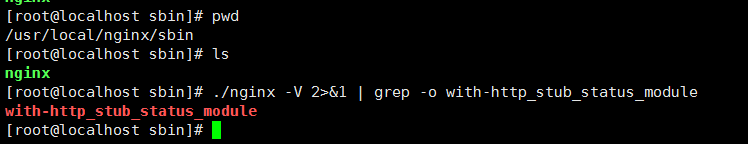
4.检查是否开启 tub_status 模块(返回with-http_stub_status_module则表示已经安装,若没有返回,请重新编译安装nginx)
cd /usr/local/nginx/sbin
./nginx -V 2>&1 | grep -o with-http_stub_status_module
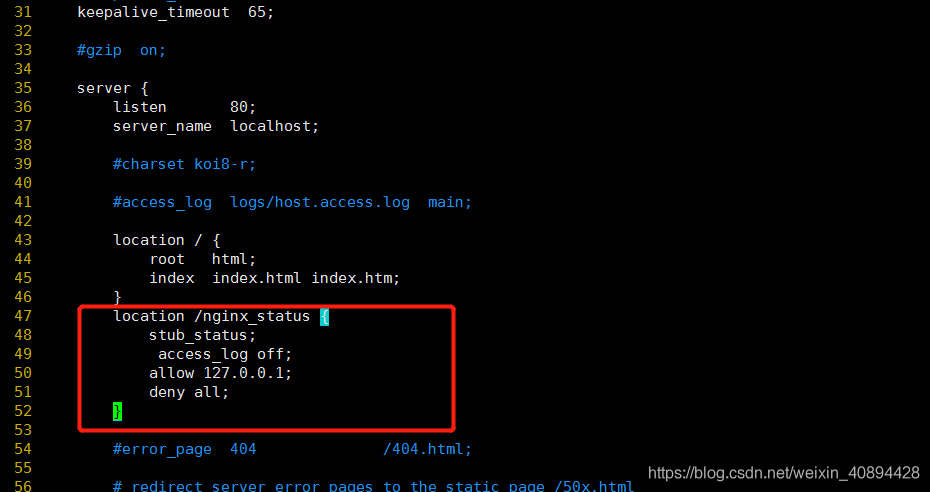
5.修改nginx配置文件
cd /usr/local/nginx/conf
vim nginx.conf
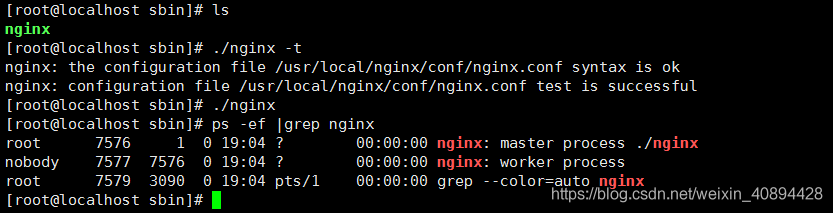
6.检查并重新加载 nginx 的配置使其生效
cd /usr/local/nginx/sbin
./nginx -t
./nginx
7.下载nginx-prometheus-exporter(网页下载)
地址:https://github.com/nginxinc/nginx-prometheus-exporter/releases
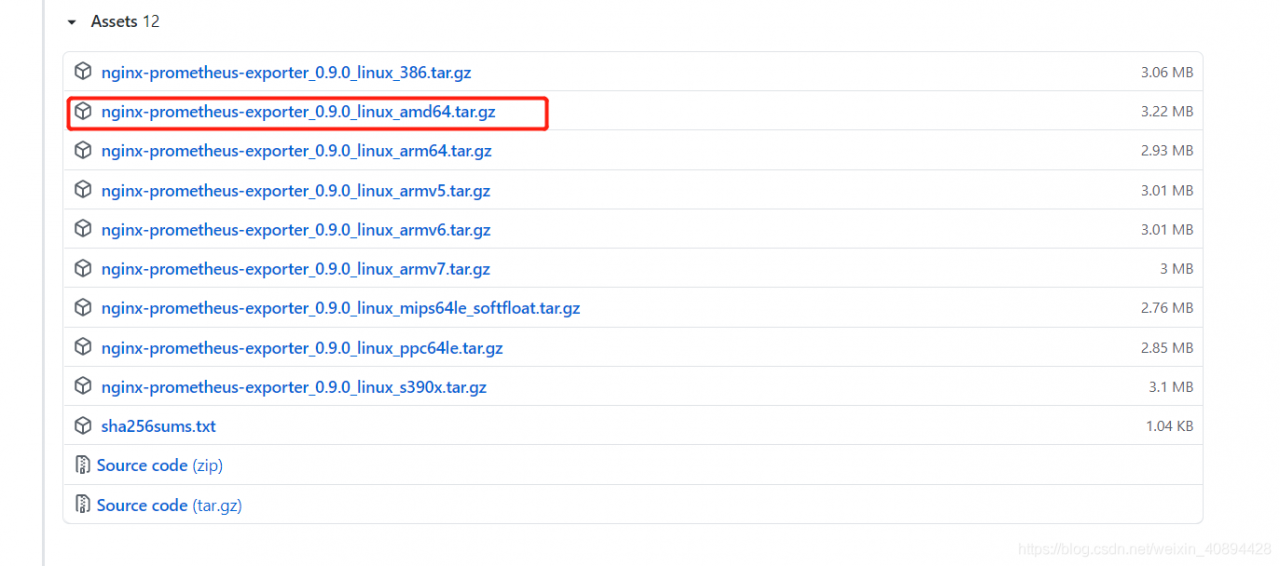
8.解压文件到/opt/aspire/product/nginx_exporter
mkdir -p /opt/aspire/product/nginx_exporter
tar zxvf nginx-prometheus-exporter_0.9.0_linux_amd64.tar.gz -C /opt/aspire/product/nginx_exporter/
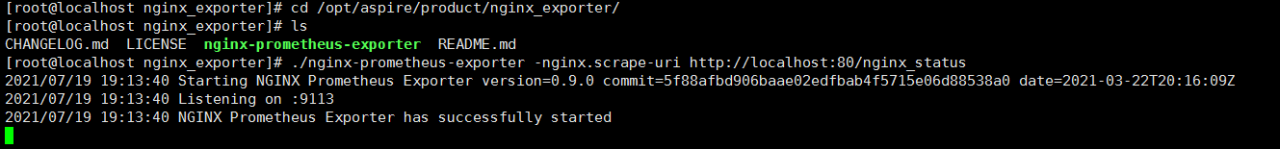
9.启动nginx-prometheus-exporter服务
cd /opt/aspire/product/nginx_exporter/
./nginx-prometheus-exporter -nginx.scrape-uri http://localhost:80/nginx_status
10.下载prometheus
wget https://github.com/prometheus/prometheus/releases/download/v2.28.1/prometheus-2.28.1.linux-amd64.tar.gz
11.解压prometheus到目录/opt/aspire/product/,并把文件夹重命名为prometheus
tar zxvf prometheus-2.28.1.linux-amd64.tar.gz -C /opt/aspire/product/
mv prometheus-2.28.1.linux-amd64 prometheus
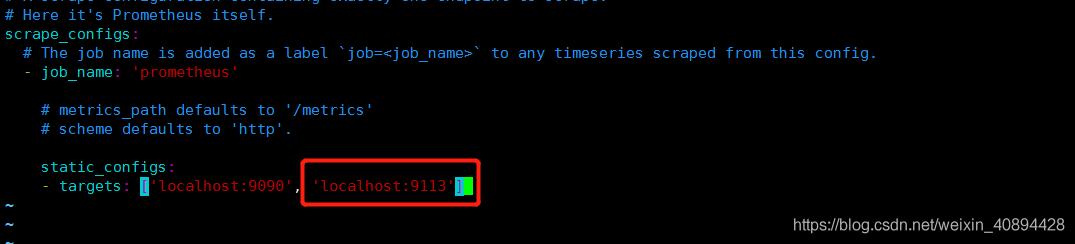
12.修改prometheus配置文件,在原有的配置上追加nginx-prometheus-exporter地址,nginx-prometheus-exporter默认端口是9113
cd /opt/aspire/product/prometheus
vim prometheus.yml
13.启动prometheus
cd /opt/aspire/product/prometheus
nohup ./prometheus &
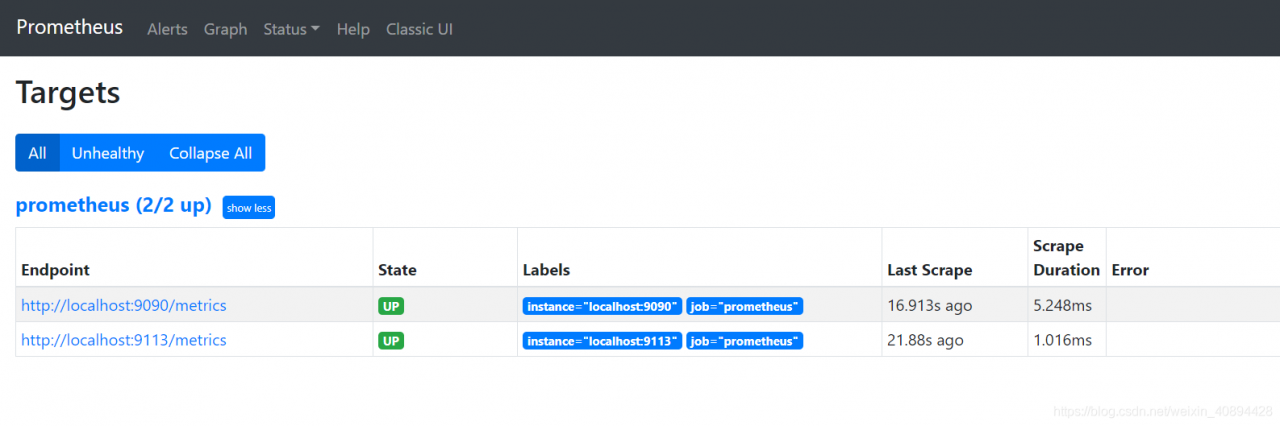
14.打开网页验证是否成功,http://localhost:9090/targets
15.下载grafana并解压到/opt/aspire/product/,把文件夹重名名为grafana
wget https://dl.grafana.com/oss/release/grafana-8.0.6.linux-amd64.tar.gz
tar zxvf grafana-8.0.6.linux-amd64.tar.gz -C /opt/aspire/product/
mv grafana-8.0.6 grafana
16.启动grafana
cd /opt/aspire/product/grafana/bin
nohup ./grafana-server &
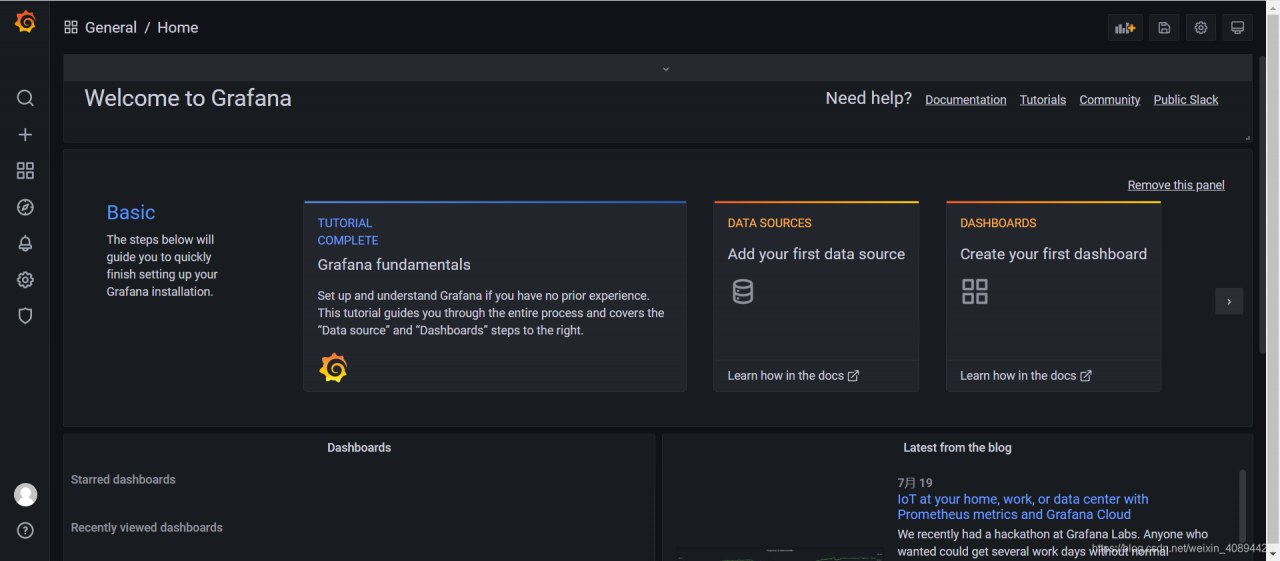
17.验证页面,http://localhost:3000,初始账号密码都是admin
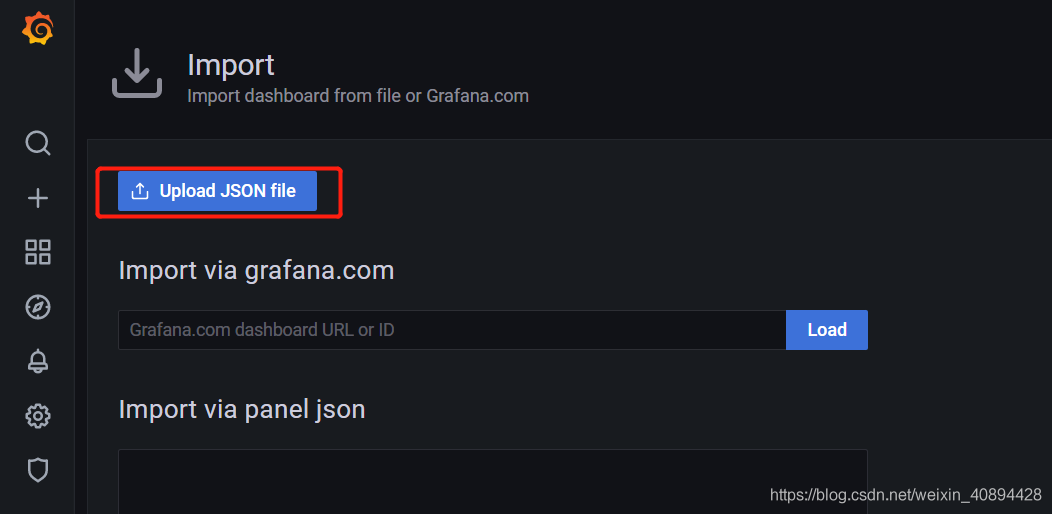
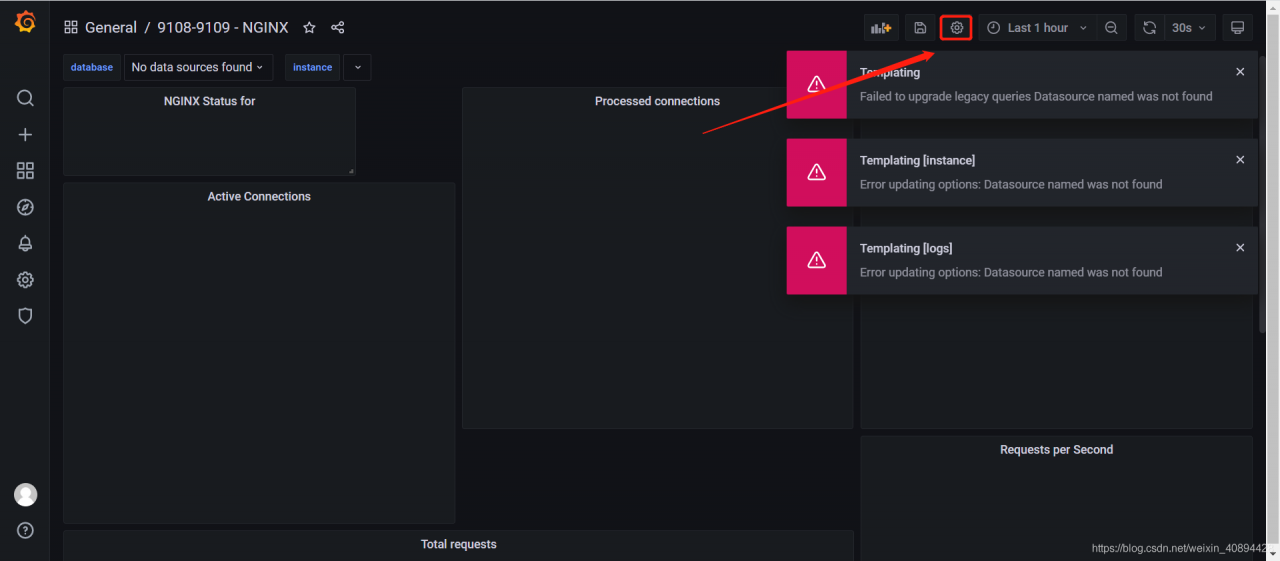
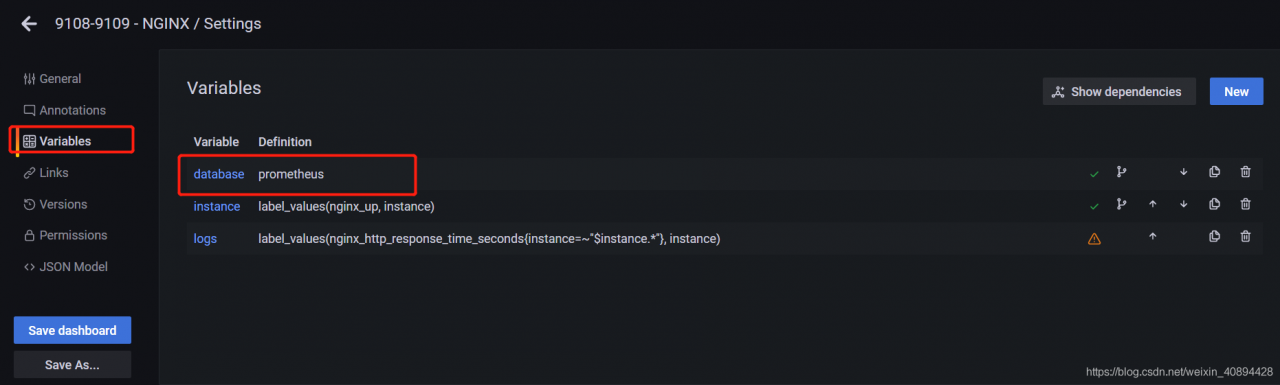
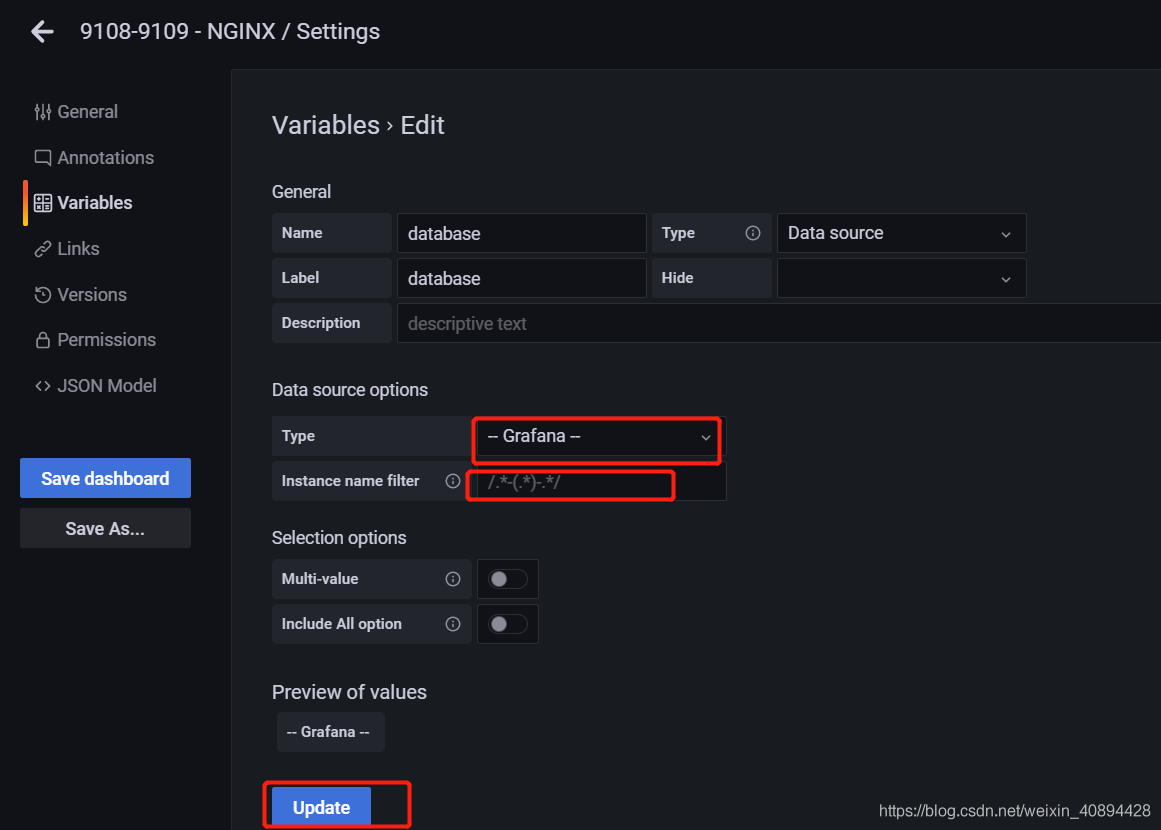
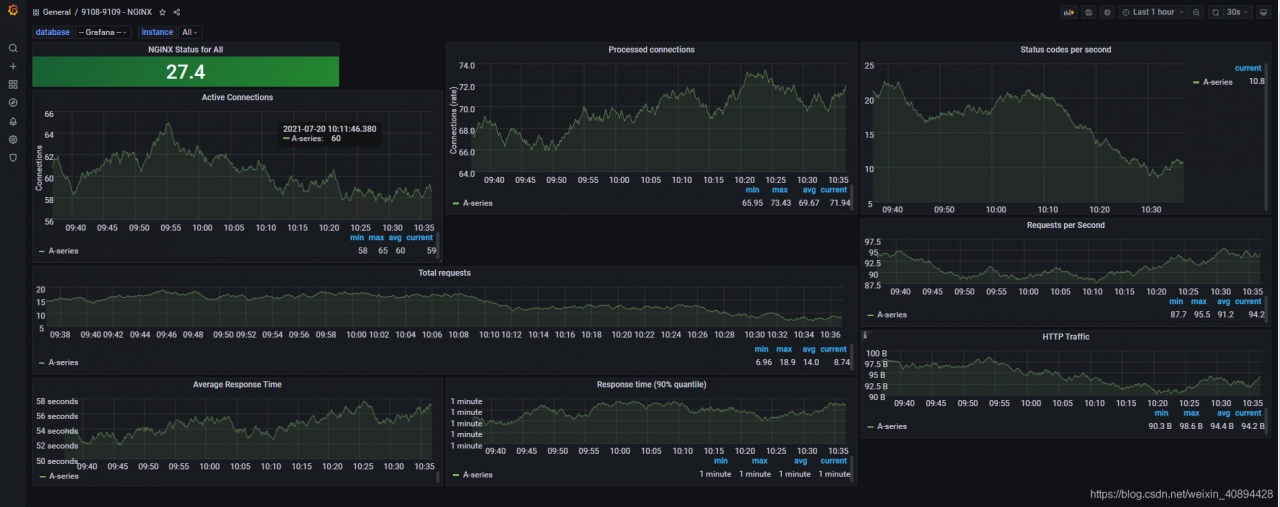
18.下载nginx-prometheus-exporter对应的grafana模板的json文件
https://grafana.com/api/dashboards/13577/revisions/1/download
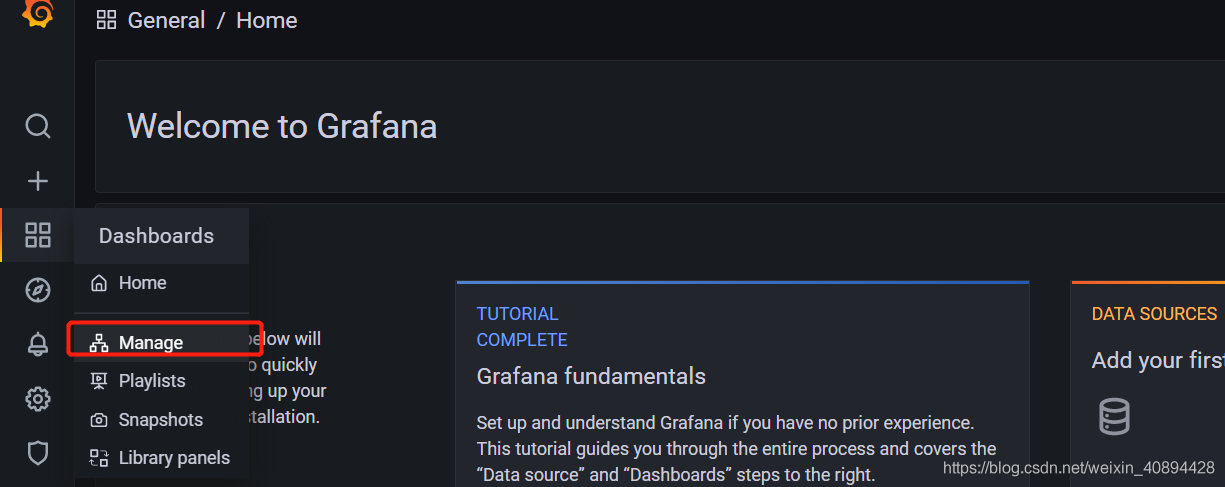
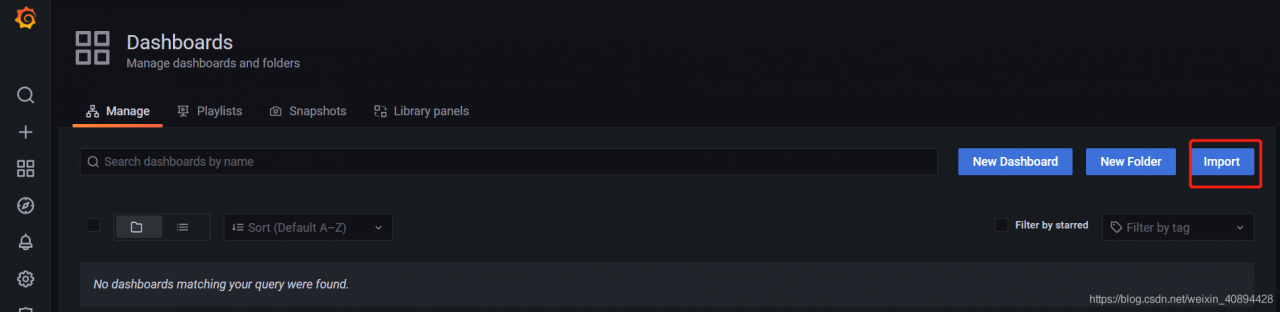
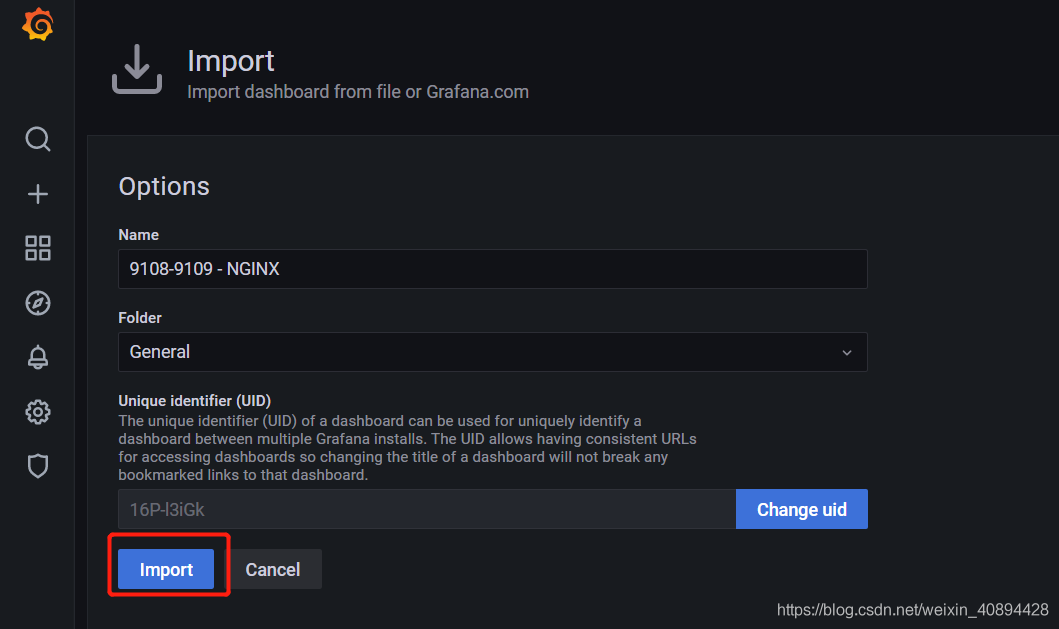
然后把这个json文件导入grafana,下面步骤见截图。