option.tooltip.formatter 修改了鼠标划过显示效果
效果: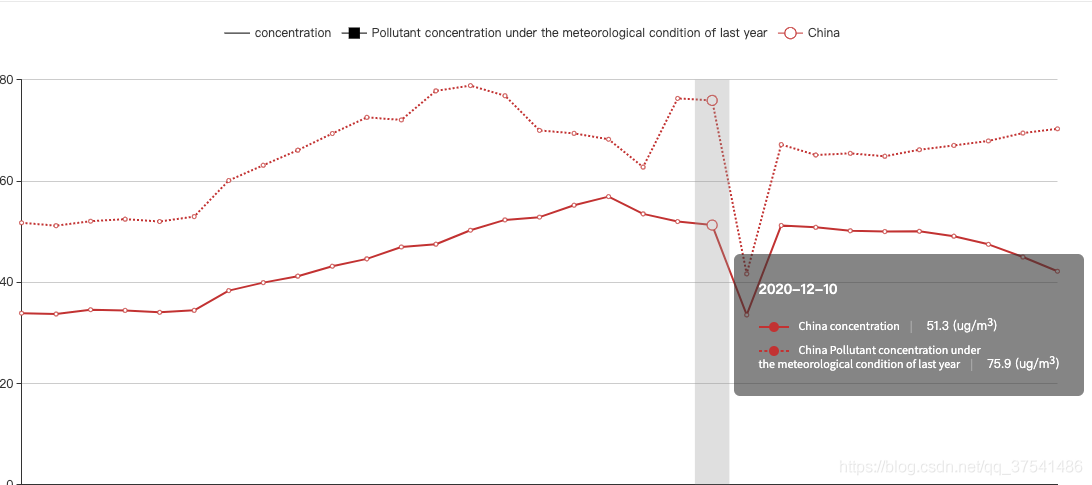
var legendData = ['concentrationAct','concentrationMet']
var series = [
    {
        name: legendData[0],
        type: 'line',
        symbol:'image://data:image/gif;base64,R0lGODlhEAAQAMQAAORHHOVSKudfOulrSOp3WOyDZu6QdvCchPGolfO0o/XBs/fNwfjZ0frl3/zy7wAAAAAAAAAAAAAAAAAAAAAAAAAAAAAAAAAAAAAAAAAAAAAAAAAAAAAAAAAAAAAAACH5BAkAABAALAAAAAAQABAAAAVVICSOZGlCQAosJ6mu7fiyZeKqNKToQGDsM8hBADgUXoGAiqhSvp5QAnQKGIgUhwFUYLCVDFCrKUE1lBavAViFIDlTImbKC5Gm2hB0SlBCBMQiB0UjIQA7',
        color:'#000',
    },
    {
        name: legendData[1],
        color:'#000',
        type: 'line',
        smooth:false,   //关键点,为true是不支持虚线的,实线就用true
        itemStyle:{
            normal:{
                lineStyle:{
                    width:2,
                    type:'dotted'  //'dotted'虚线 'solid'实线
                }
            }
        },
    }
]


var option = {
	    // color: ['#ccc','#ccc','#C296F9', '#75C88C','red','yellow'],
	    tooltip: {
	        trigger: 'axis',
	        axisPointer: {
	            type: 'shadow'
	        },
	        backgroundColor: 'rgba(51, 51, 51, 0.6)',
	        borderRadius: '6',
	        formatter: function(data){
	            var html = '';
	            for (var i = 0; i < data.length; i++) {
	                var markBg = data[i].marker,
	                value = data[i].value ? data[i].value.toFixed(1) :'-',
	                color = data[i].color;
	                var dottedline = '<div style="display:inline-block;top: -2px;margin-right:5px;width:30px;height:2px;border:1px dashed '+color+';position:relative; "><div style="display:inline-block;position:absolute;left:50%;top:50%;margin-left:-5px;margin-top:-6px;">'+markBg+'</div></div>'
	                var solidline = '<div style="display:inline-block;top: -2px;margin-right:5px;width:30px;height:2px;border:1px solid '+color+';position:relative; "><div style="display:inline-block;position:absolute;left:50%;top:50%;margin-left:-5px;margin-top:-6px;">'+markBg+'</div></div>'

	                if(data[i].seriesId.charAt(data[i].seriesId.length-1)  == 0){
	                    var hoverStyle = solidline
	                    var nameDesc = $.i18n.prop('concentrationAct')
	                }else if(data[i].seriesId.charAt(data[i].seriesId.length-1) == 1){
	                    var hoverStyle = dottedline
	                    var nameDesc = $.i18n.prop('concentrationMet')
	                }

	                html +=  '<div style="font-size: 12px;line-height: 14px;margin-bottom:10px">'+
	                        hoverStyle +
	                        '<span style="margin-left:5px">'+data[i].seriesName + nameDesc +'</span><span style="margin:0 10px;color:rgba(255,255,255,0.3)">|</span>  '+value+ '  ('+$.i18n.prop('unit1')+')</div>'
	            }
	            data.marker = '<div>'+
	                                '<div style="margin:20px;font-weight: bold;font-size: 14px;line-height: 20px;">'+data[0].axisValue+'</div>' +
	                                '<div style="margin:20px;">'+html+'</div>'+
	                        '</div>'

	                        console.log(data.marker);
	            return data.marker;
	        },
	    },
	    legend: legendData,
	    grid: {
	        top:'15%',
	        left: '3%',
	        right: '4%',
	        bottom: '3%',
	        containLabel: true
	    },
	    xAxis: {
	        type: 'category',
	        boundaryGap: false,
	        data: option.xAxis,
	    },
	    yAxis: {
	        type: 'value'
	    },
	    series: series
	};
版权声明:本文为qq_37541486原创文章,遵循CC 4.0 BY-SA版权协议,转载请附上原文出处链接和本声明。