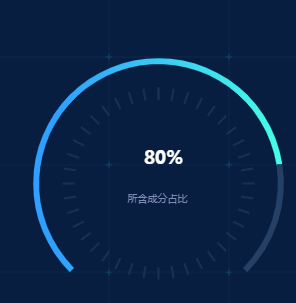
var e=80
option={

							grid: {
								top: 0,
								bottom: 0,
								left: 0,
								right: 0
							},
							title: [{
								text: e +'%',
								x: '50%',
								y: '37%',
								textAlign: 'center',
								textStyle: {
									fontSize: '18',
									color: '#fff',
									textAlign: 'center',
								},
							}, {
								text: '所含成分占比',
								left: '48%',
								top: '52%',
								textAlign: 'center',
								textStyle: {
									fontSize: '10',
									fontWeight: '400',
									color: '#7D8CB5',
									textAlign: 'center',
								},
							}, ],
							polar: {
								radius: ['85%', '75%'],
								center: ['50%', '50%'],
							},
							angleAxis: {
								max: 100,
								show: false,
							},
							radiusAxis: {
								type: 'category',
								show: true,
								axisLabel: {
									show: false,
								},
								axisLine: {
									show: false,

								},
								axisTick: {
									show: false
								},
							},

							series: [{
									name: "内部进度条",
									type: "gauge",
									center: ["50%", "50%"],
									radius: '85%',
									splitNumber: 10,
									axisLine: {
										lineStyle: {
											color: [
												[ e / 100, new echarts.graphic.LinearGradient(0, 0, 1, 0, [{
															offset: 0.1,
															color: "#2FA0FF"
														},{
															offset: 1,
															color: "#45FFE7"
														}
													])],
													[1, "#253F65"]
												],
												width: 6
											}
										},
										axisLabel: {
											show: false,
										},
										axisTick: {
											show: false,

										},
										splitLine: {
											show: false,
										},
										itemStyle: {
											show: false,
										},
										detail: {
											show: false,
										},
										label: {
											show: false
										},
										title: { //标题
											show: false,
										},
										data: [{
											name: "title",
											value: e,
										}],
										pointer: {
											show: false,
										},
									},
									{
										type: 'gauge',
										radius: '65%',
										clockwise: false,
										startAngle: '90',
										endAngle: '-269.9999',
										backgroundColor: '#051F54',
										//调整间隔距离
										splitNumber: 40,
										detail: {
											offsetCenter: [0, -40],
											formatter: ' '
										},
										pointer: {
											show: false
										},
										axisLine: {
											show: true,
											lineStyle: {
												color: '#253F65',
												width: 10,
												backgroundColor: '#051F54',
											}
										},
										axisTick: {
											show: false
										},
										splitLine: {
											show: true,
											length: 12,
											lineStyle: {
												color: '#1c304d',
												backgroundColor: '#051F54',
												width: 2
											}
										},
										axisLabel: {
											show: false
										}
									},


								]
							}


methods:{
getdata()  {
				for (var i = 0; i < 150; ++i) {
					this.labelData.push({
						value: 1,
						name: i,
						itemStyle: {
							normal: {
								color: 'rgba(0,209,228,0)',
							}
						}
					});
				}
				for (var i = 0; i < this.labelData.length; ++i) {
					if (this.labelData[i].name < 50) {
						this.labelData[i].itemStyle = {
							normal: {
								color: '#5467df'
							},

						}
					}
				}
				for (var i = 0; i < 150; ++i) {
					this.labelData1.push({
						value: 1,
						name: i,
						itemStyle: {
							normal: {
								color: 'rgba(0,209,228,0)',
							}
						}
					});
				}
				for (var i = 0; i < this.labelData1.length; ++i) {
					if (this.labelData1[i].name < 150) {
						this.labelData1[i].itemStyle = {
							normal: {
								color: '#251f45'
							},

						}
					}
				}

			},
}

	mounted() {
			this.getdata()

		},
版权声明:本文为weixin_45549435原创文章,遵循CC 4.0 BY-SA版权协议,转载请附上原文出处链接和本声明。