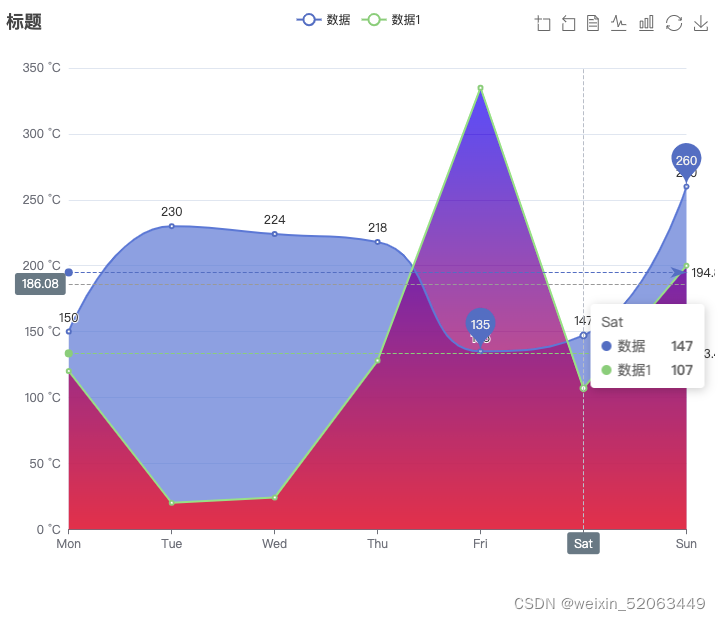
option = {
title: {
text: '标题' //标题
},
tooltip: {
//鼠标悬浮显示数据
trigger: 'axis',
axisPointer: {
type: 'cross',
label: {
backgroundColor: '#6a7985'
}
}
},
legend: {
data: ['数据', '数据1'] //图例
},
grid: {
//图的边距
left: '3%', //左边距
right: '4%', //右边距
bottom: '12%', //下边距
containLabel: true
},
toolbox: {
//右上角功能
show: true,
feature: {
dataZoom: {
yAxisIndex: 'none' //缩放区域,缩放还原区域
},
dataView: { readOnly: false }, //数据视图
magicType: { type: ['line', 'bar'] }, //柱状/折线切换
restore: {}, //还原
saveAsImage: {} //保存图片
}
},
xAxis: {
boundaryGap: false, //x轴两秒不留空隙
type: 'category',
data: ['Mon', 'Tue', 'Wed', 'Thu', 'Fri', 'Sat', 'Sun'] //X轴标题
},
yAxis: {
type: 'value', //y轴是数值
axisLabel: {
formatter: '{value} °C' //Y轴单位
}
},
series: [
{
itemStyle: {
//显示每个点数值
normal: {
label: {
show: true
}
}
},
name: '数据', //这条数据的名字
type: 'line', //图类型
data: [150, 230, 224, 218, 135, 147, 260], //y轴对应的数据
areaStyle: {
//颜色覆盖区域
},
markLine: {
data: [
{ type: 'average', name: 'Avg' } // 指向性虚线平均值
]
},
markPoint: {
data: [
{ type: 'max', name: 'Max' },
{ type: 'min', name: 'Min' }
]
},
smooth: true //折线平滑
},
{
name: '数据1', //这条数据的名字
type: 'line', //图类型,
areaStyle: {
//颜色覆盖区域
normal: {
color: {
type: 'linear',
x: 0,
y: 0,
x2: 0,
y2: 1,
colorStops: [
{
offset: 0,
color: 'blue' //0%处颜色
},
{
offset: 1,
color: 'red' //100%处颜色
}
]
}
}
},
data: [120, 20, 24, 128, 335, 107, 200], //y轴对应的数据
markLine: {
data: [
{ type: 'average', name: 'Avg' } // 指向性虚线平均值
]
},
smooth: false //折线平滑
}
]
};