蚂蚁图表地址:蚂蚁图表 antv f2 - DCloud 插件市场
使用HBuilderX导入插件
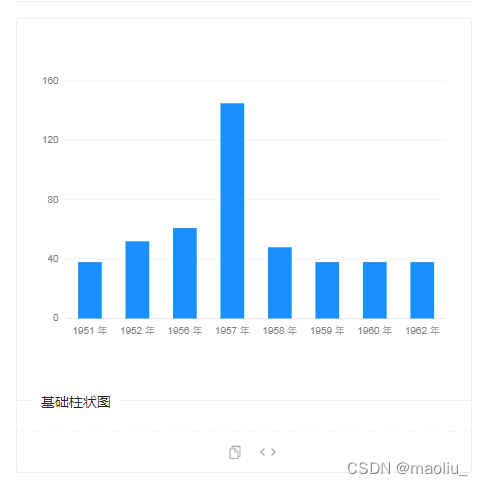
点击“代码示例站点1”,找到需要的表格,以柱状图为例。
点击查看代码,复制代码。
以下是我的示例代码。
<template>
	<view style="height:  750rpx">
		<l-f2 ref="chart"></l-f2>
	</view>
</template>

<script>
	import F2 from '@/uni_modules/lime-f2/components/l-f2/f2.min.js';
	export default {
		data() {
			return {
				data : [{
					year: '1月',
					sales: 2500
					}, {
					year: '2月',
					sales: 5200
					},{
					year: '3月',
					sales: 521
					},{
					year: '4月',
					sales: 24
					}, {
					year: '5月',
					sales: 61
					}, {
					year: '6月',
					sales: 10
					}, {
					year: '7月',
					sales: 48
					}, {
					year: '8月',
					sales: 0
					}, {
					year: '9月',
					sales: 0
					}, {
					year: '10月',
					sales: 0
					},{
					year: '11月',
					sales: 1500
					},{
					year: '12月',
					sales: 1200
					}],
			}
		},
		mounted() {
			this.$refs.chart.init(config => {
				const chart = new F2.Chart(config);
				chart.source(this.data, {
				sales: {
					tickCount: 5
				}
				});
				chart.tooltip({
					showItemMarker: false,
					onShow: function onShow(ev) {
						const items = ev.items;
						items[0].name = null;
						items[0].name = items[0].title;
						items[0].value = '¥ ' + items[0].value;
					}
				});
				chart.interval().position('year*sales');
				chart.render();
				return chart;
			});
		}
	}
</script>
想要更新表格和数据。可以参考官方文档说明。
mounted() {
this.$refs.chart.init(config => {
const chart = new F2.Chart(config);
chart.source(this.data, {
sales: {
tickCount: 5
}
});
chart.tooltip({
showItemMarker: false,
onShow: function onShow(ev) {
const items = ev.items;
items[0].name = null;
items[0].name = items[0].title;
items[0].value = '¥ ' + items[0].value;
}
});
chart.interval().position('year*sales');
chart.render();
return chart;
});
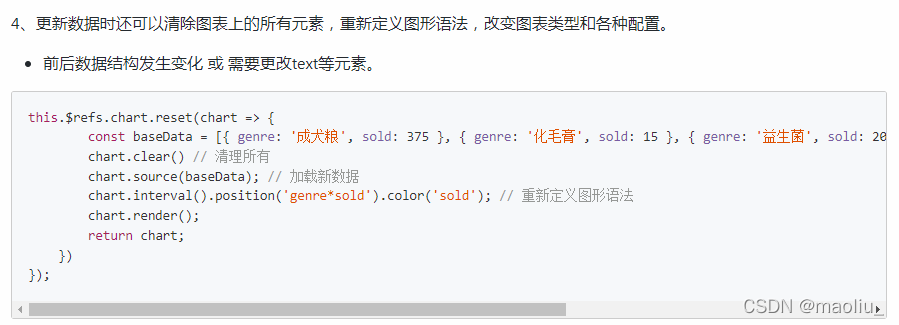
this.$refs.chart.reset(chart => {
const baseData = [{
year: '1月',
sales: 2500
}, {
year: '2月',
sales: 5200
},{
year: '3月',
sales: 521
},{
year: '4月',
sales: 24
}, {
year: '5月',
sales: 61
}, {
year: '6月',
sales: 10
}, {
year: '7月',
sales: 48
}, {
year: '8月',
sales: 0
}, {
year: '9月',
sales: 0
}, {
year: '10月',
sales: 0
},{
year: '11月',
sales: 1500
},{
year: '12月',
sales: 1200
}];
chart.clear() // 清理所有
chart.source(baseData, {//加载新数据
sales: {
tickCount: 5
}
});
chart.interval().position('year*sales'); // 重新定义图形语法
chart.render();
return chart;
});
}版权声明:本文为maoliu_原创文章,遵循CC 4.0 BY-SA版权协议,转载请附上原文出处链接和本声明。