集群监控:zabbix、cacti(流量与性能监测为主 状态监测较差)、Nagios(服务与性能监测为主 监控监测好 展示差 收集方式 C/S (脚本 预定义))等,zabbix较为主流集合后两者优点,且开源。
zabbix由zabbix-server zabbix-agent 构成
zabbix定义:是一个基于web界面的提供分布式系统监视以及网络监视功能的企业级开源解决方案
zabbix服务环境:LAMP,防火墙关闭,服务端需要有网,centos7
配置环境
[root@192 ~]# ifconfig
eth0: flags=4163<UP,BROADCAST,RUNNING,MULTICAST>  mtu 1500
        inet 192.168.2.202  netmask 255.255.255.0  broadcast 192.168.2.255
[root@192 yum.repos.d]# systemctl stop firewalld;setenforce 0
[root@192 ~]# mount /dev/sr0 /mnt
[root@192 ~]# cd /etc/yum.repo.d/
[root@192 yum.repos.d]# ls
bak               CentOS-CR.repo         CentOS-fasttrack.repo  CentOS-Sources.repo  media.repo
CentOS-Base.repo  CentOS-Debuginfo.repo  CentOS-Media.repo      CentOS-Vault.repo
#安装需要的包 mysql闭源了这里用mariadb
[root@192 yum.repos.d]# yum -y install httpd mariadb mariadb-server php php-mysql
#启动
[root@192 yum.repos.d]# systemctl restart httpd;systemctl restart mariadb
#初始化数据库
[root@192 yum.repos.d]# mysql_secure_installation

NOTE: RUNNING ALL PARTS OF THIS SCRIPT IS RECOMMENDED FOR ALL MariaDB
      SERVERS IN PRODUCTION USE!  PLEASE READ EACH STEP CAREFULLY!

In order to log into MariaDB to secure it, we'll need the current
password for the root user.  If you've just installed MariaDB, and
you haven't set the root password yet, the password will be blank,
so you should just press enter here.
#第一次回车即可
Enter current password for root (enter for none):
OK, successfully used password, moving on...

Setting the root password ensures that nobody can log into the MariaDB
root user without the proper authorisation.
#是否给root设置密码
Set root password? [Y/n] y
New password:
Re-enter new password:
Password updated successfully!
Reloading privilege tables..
 ... Success!


By default, a MariaDB installation has an anonymous user, allowing anyone
to log into MariaDB without having to have a user account created for
them.  This is intended only for testing, and to make the installation
go a bit smoother.  You should remove them before moving into a
production environment.
#是否删除默认users
Remove anonymous users? [Y/n] y
 ... Success!

Normally, root should only be allowed to connect from 'localhost'.  This
ensures that someone cannot guess at the root password from the network.
#是否允许远程连接
Disallow root login remotely? [Y/n] n
 ... skipping.

By default, MariaDB comes with a database named 'test' that anyone can
access.  This is also intended only for testing, and should be removed
before moving into a production environment.
#是否删除测试数据库
Remove test database and access to it? [Y/n] y
 - Dropping test database...
 ... Success!
 - Removing privileges on test database...
 ... Success!

Reloading the privilege tables will ensure that all changes made so far
will take effect immediately.
#是否刷新权限
Reload privilege tables now? [Y/n] y
 ... Success!

Cleaning up...

All done!  If you've completed all of the above steps, your MariaDB
installation should now be secure.

Thanks for using MariaDB!

#建立zabbix数据库
[root@192 yum.repos.d]# mysql -uroot -p
MariaDB [(none)]> create database zabbix default character set utf8 collate utf8_bin;
MariaDB [(none)]> grant all privileges on zabbix.* to zabbix@localhost identified by 'zabbix';
MariaDB [(none)]> quit
zabbix服务安装与配置
#安装zabbix 需联网,本地包版本有不匹配的需要联网更新
[root@192 yum.repos.d]# rpm -ivh https://repo.zabbix.com/zabbix/3.2/rhel/7/x86_64/zabbix-release-3.2-1.el7.noarch.rpm
[root@192 yum.repos.d]# rpm --import /etc/pki/rpm-gpg/RPM-GPG-KEY-ZABBIX
#zabbix-server-mysql zabbix-web-mysql 服务端, zabbix-agent 客户端, 这里也可以安装客户端包检测本机
[root@192 yum.repos.d]# yum -y install zabbix-server-mysql zabbix-web-mysql
#将zabbix的数据库包信息导入到 "zabbix数据库"
[root@192 yum.repos.d]# cd /usr/share/doc/zabbix-server-mysql-3.2.11/
[root@192 zabbix-server-mysql-3.2.11]# zcat create.sql.gz | mysql -u root -p123456 zabbix
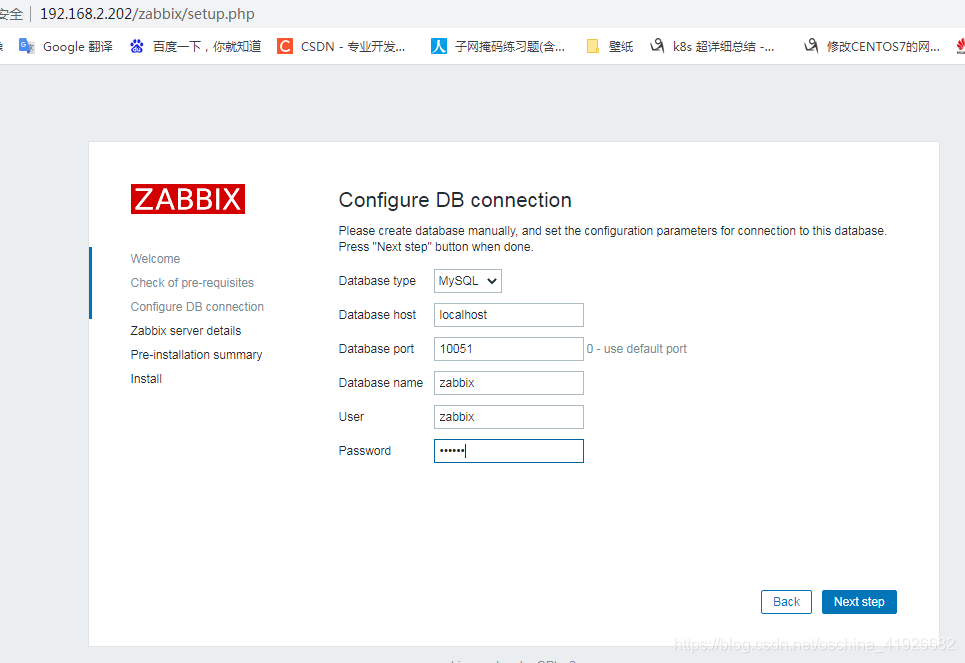
#配置zabbix_server
[root@192 zabbix-server-mysql-3.2.11]# vim /etc/zabbix/zabbix_server.conf
#前面的数字为行号
81 DBHost=localhost
115 DBPassword=zabbix
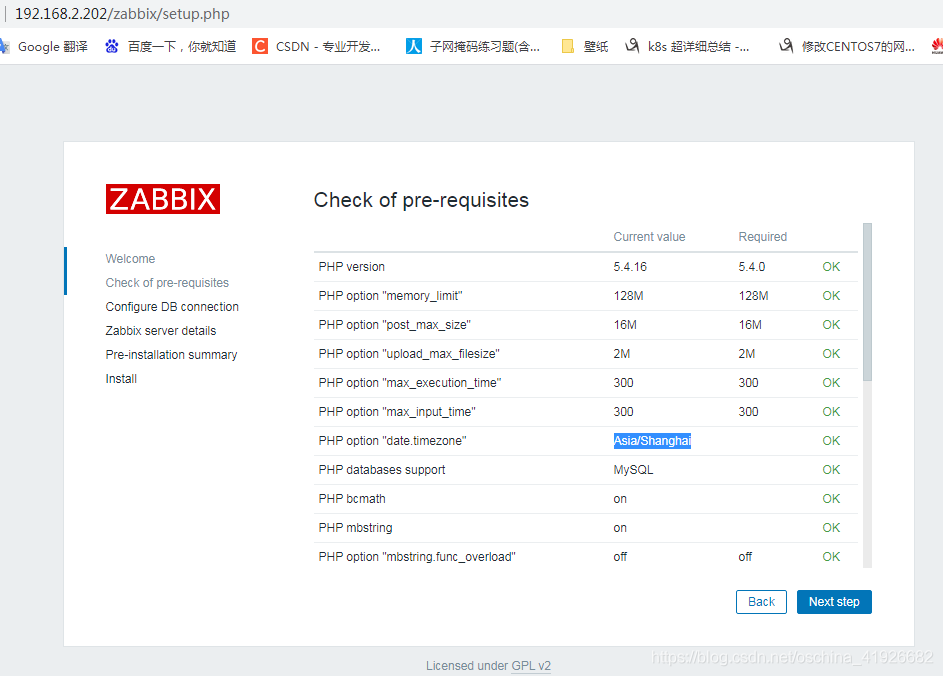
#配置时区
[root@192 zabbix-server-mysql-3.2.11]# vim /etc/httpd/conf.d/zabbix.conf
php_value date.timezone Asia/Shanghai
#重启服务
[root@192 zabbix-server-mysql-3.2.11]# systemctl restart zabbix-server;systemctl restart httpd
--------------
#host:locahost
#zabbix端口:10051
#密码:zabbix
#Name:zabbix
--------------
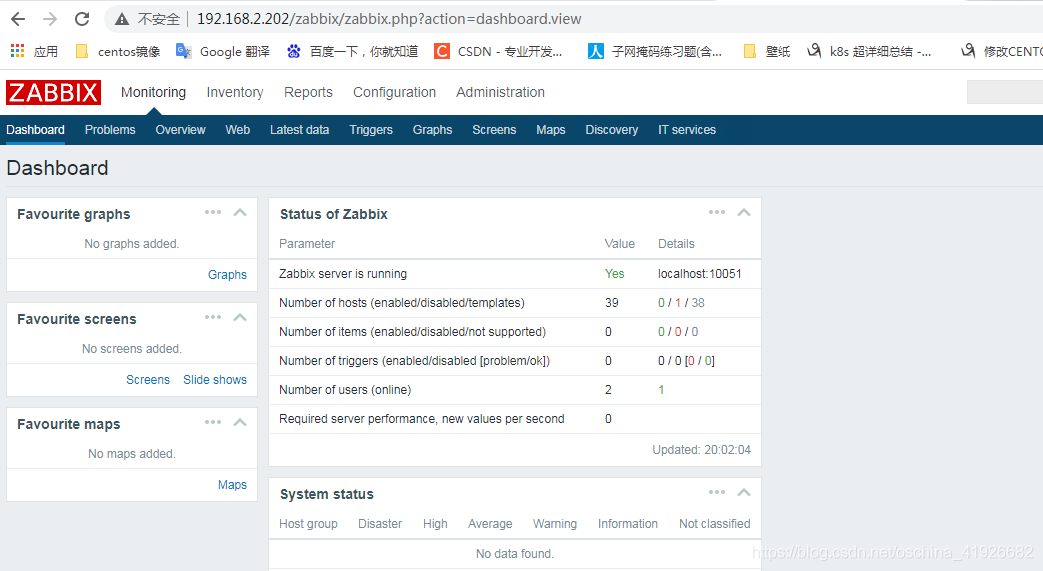
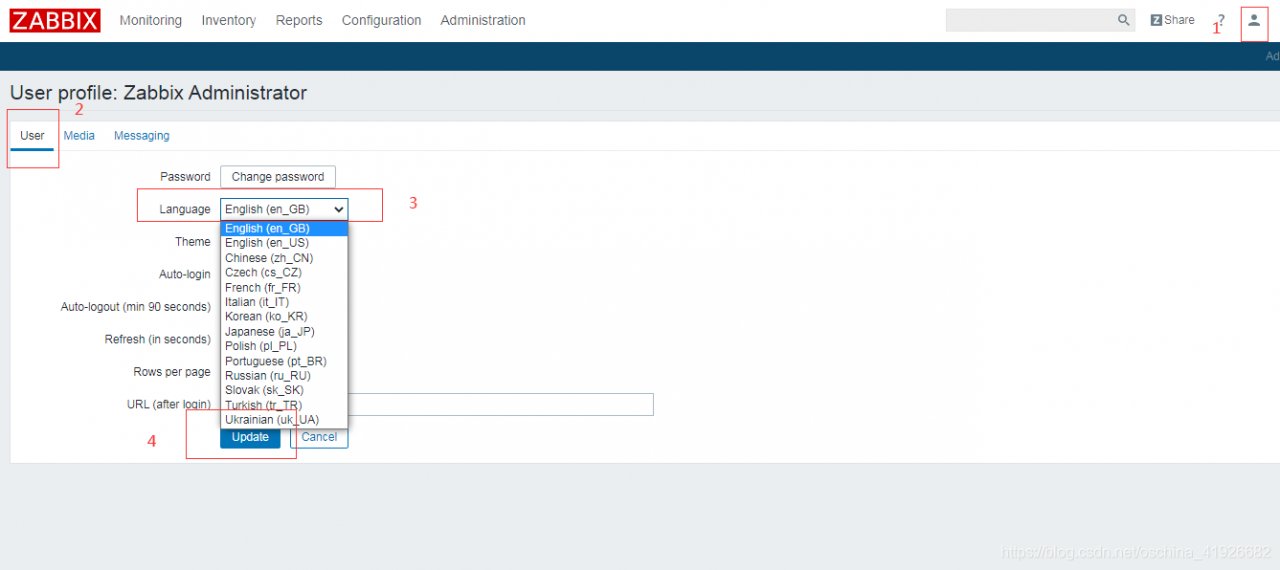
web界面显示为中文
点小人==>User==>Language==>Chinese==>Update
配置监控(手动配置)
---zabbix-agent配置
#本机监测
安装方法一 在有前两部的情况下 yum安装速度慢
#[root@192 yum.repos.d]# rpm -ivh https://repo.zabbix.com/zabbix/3.2/rhel/7/x86_64/zabbix-release-3.2-1.el7.noarch.rpm
#[root@192 yum.repos.d]# rpm --import /etc/pki/rpm-gpg/RPM-GPG-KEY-ZABBIX
[root@192 zabbix-server-mysql-3.2.11]# yum -y install zabbix-agent
#配置
[root@192 zabbix-server-mysql-3.2.11]# vim /etc/zabbix/zabbix_agentd.conf
#前面的数字为行号
#server填服务机ip
95 Server=192.168.2.202
136 ServerActive=192.168.2.202
#host填本机ip
147 Hostname=192.168.2.202
[root@192 zabbix-server-mysql-3.2.11]# systemctl restart zabbix-agent

#zabbix-agent监测
[root@localhost ~]# ifconfig
eth0: flags=4163<UP,BROADCAST,RUNNING,MULTICAST>  mtu 1500
        inet 192.168.2.203  netmask 255.255.255.0  broadcast 192.168.2.255
##安装导入导出工具 在xshell中用 rpm安装
[root@localhost ~]# yum -y install lrzsz
[root@localhost ~]# ls
anaconda-ks.cfg  zabbix-agent-3.2.11-1.el7.x86_64.rpm
[root@localhost ~]# rpm -ivh zabbix-agent-3.2.11-1.el7.x86_64.rpm
95 Server=192.168.2.202
136 ServerActive=192.168.2.202
147 Hostname=192.168.2.203
[root@192 zabbix-server-mysql-3.2.11]# systemctl restart zabbix-agent
[root@localhost ~]# systemctl stop firewalld;setenforce 0
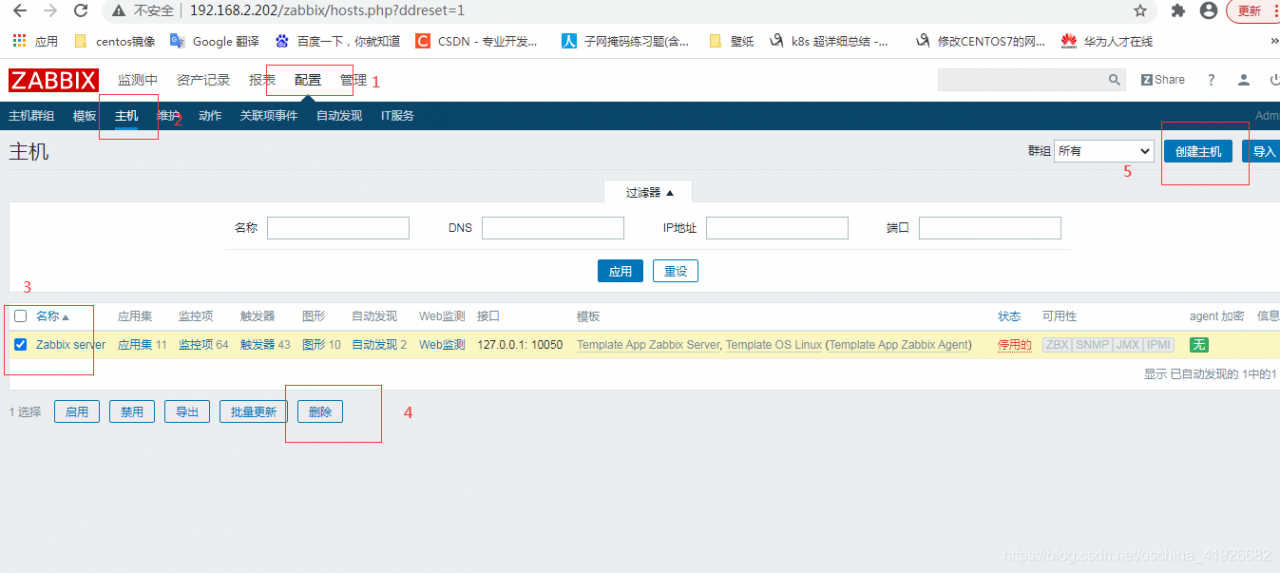
------web端配置
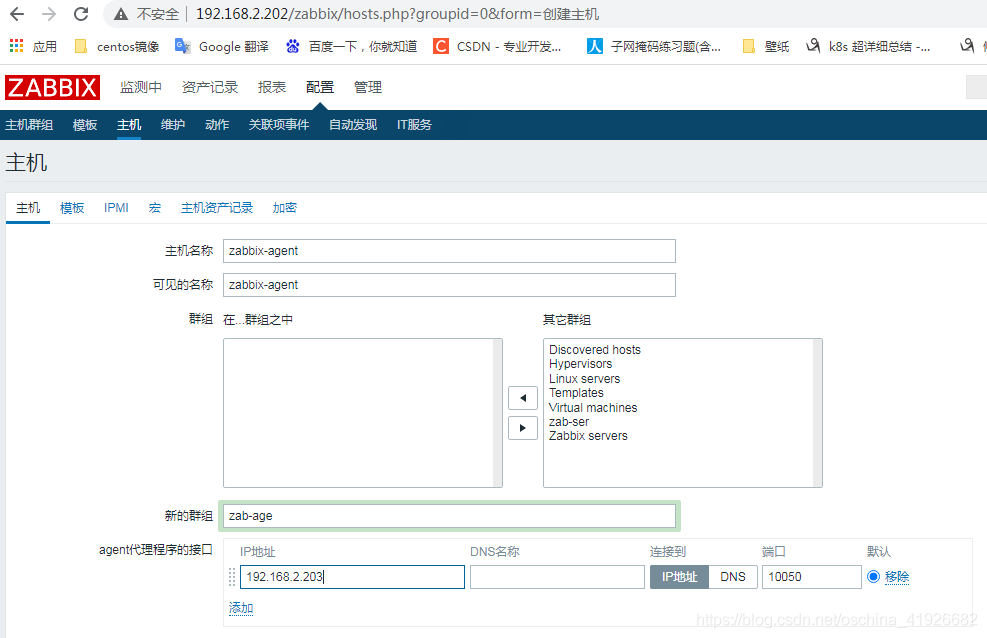
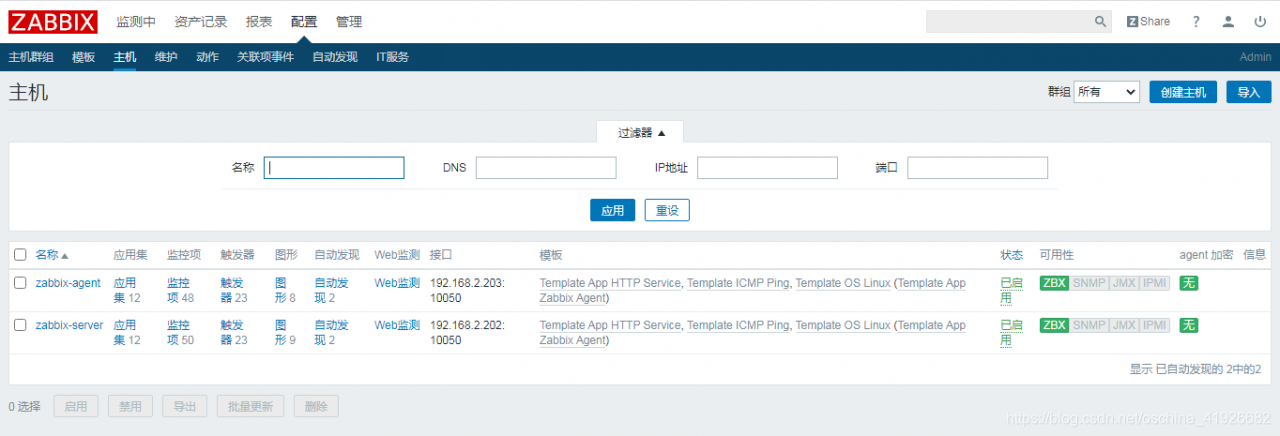
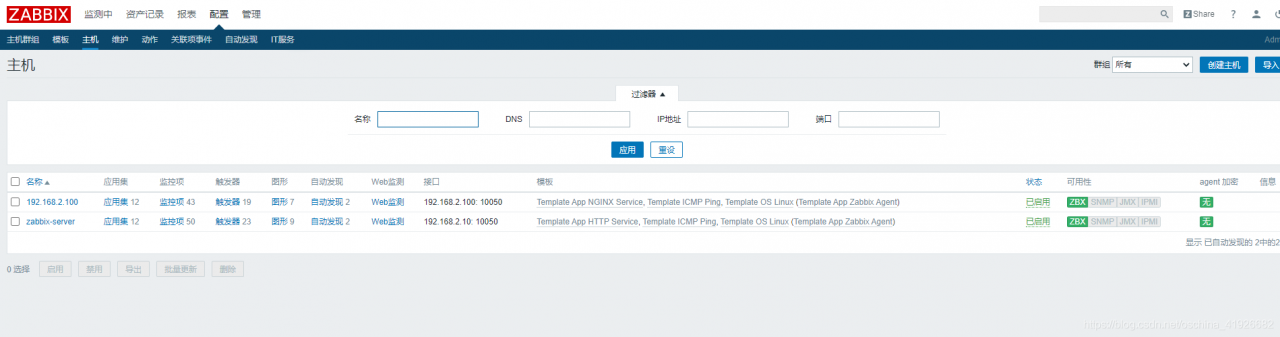
配置==>主机==>删除默认主机==>创建主机
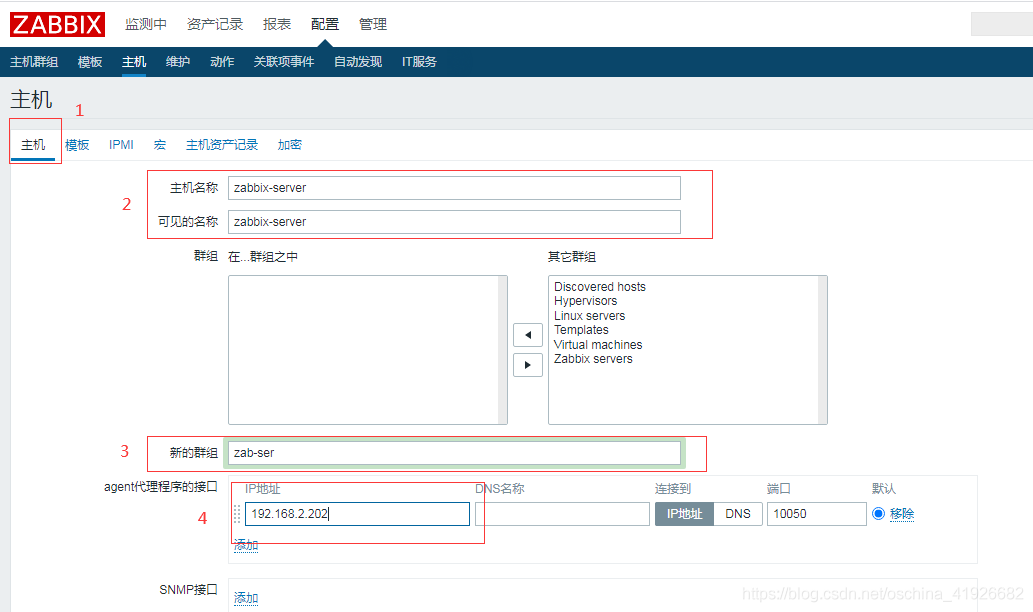
主机==>填主机名、可见名、群组(可用已有的也可新建)==>ip
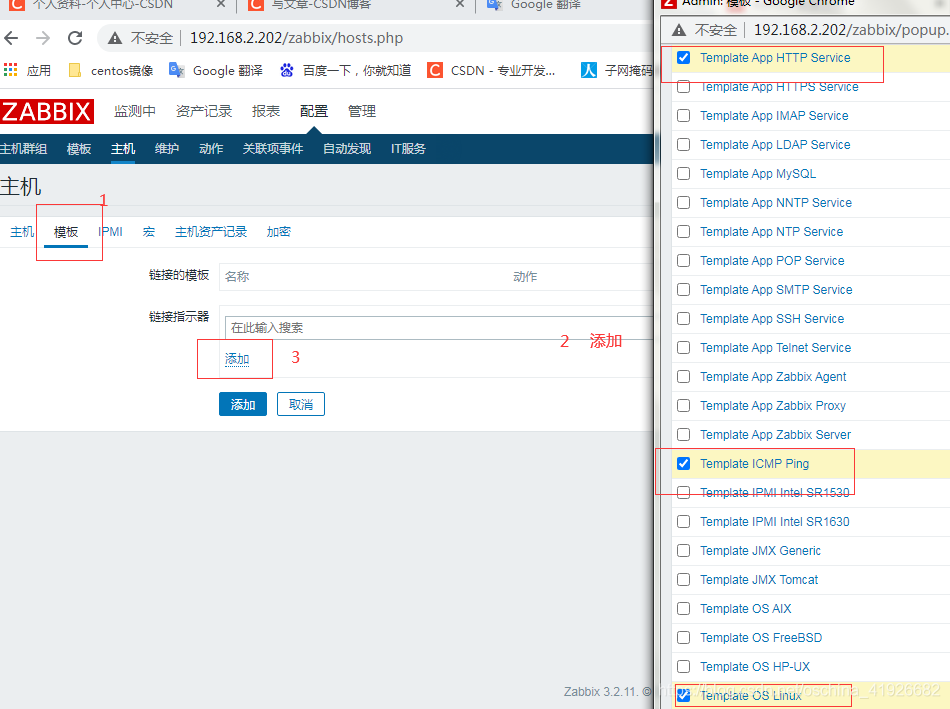
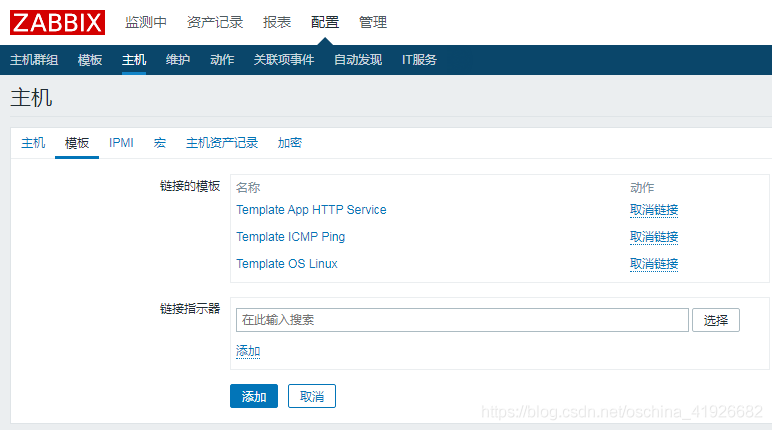
模板==>选择==>添加 http、linux os、ICMP ping==>添加==>添加
zabbix web界面 部分中文不支持
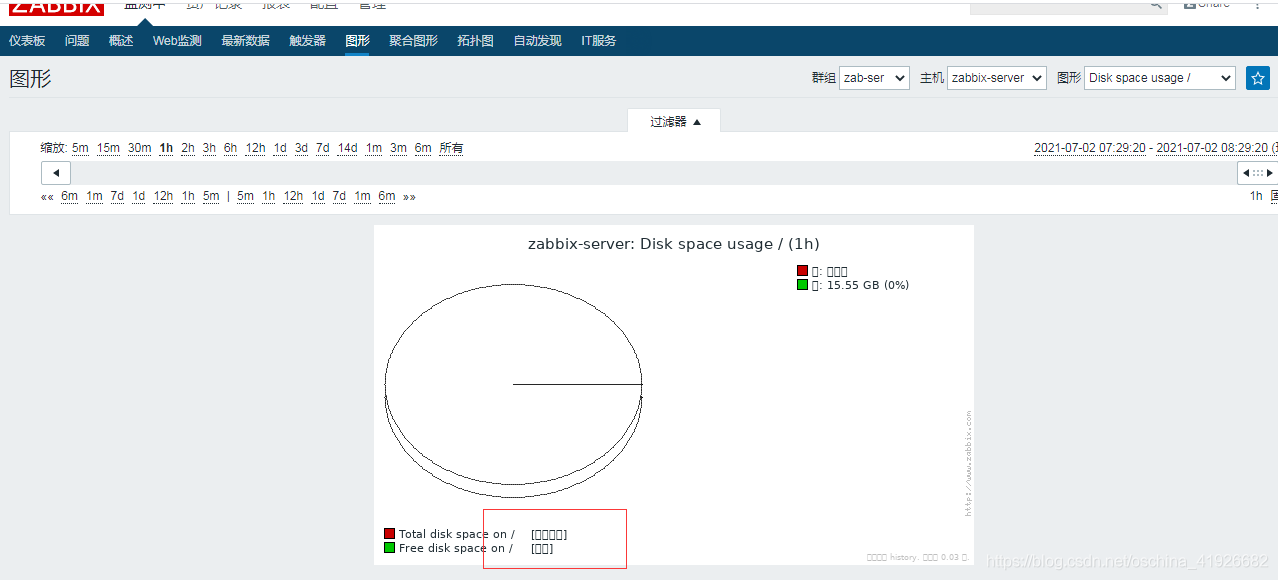
选择windows的某字体【C:\Windows\Fonts】,更改zabbix默认字体库
[root@192 ~]# mv simsun.ttc  /usr/share/zabbix/fonts/
[root@192 ~]# cd /usr/share/zabbix/fonts/
[root@192 fonts]# ls
graphfont.ttf  simsun.ttc
[root@192 fonts]# mv simsun.ttc simsun.ttf
[root@192 fonts]# chmod a+x simsun.ttf
[root@192 fonts]# vim /usr/share/zabbix/include/defines.inc.php
45 define('ZBX_GRAPH_FONT_NAME',           'simsun'); // font file name
自动发现 nginx的监控(需要自配脚本)
[root@localhost ~]# ifconfig
eth0: flags=4163<UP,BROADCAST,RUNNING,MULTICAST> mtu 1500
inet 192.168.2.100 netmask 255.255.255.0 broadcast 192.168.2.255
#准备nginx包 这里是源码安装
[root@localhost ~]# ls
anaconda-ks.cfg nginx-1.18.0.tar.gz
[root@localhost ~]# mount /dev/sr0 /mnt
#安装环境依赖
[root@localhost ~]# yum -y install gcc gcc-c++ zlib gzip zlib-devel pcre-devel
#解压
[root@localhost ~]# tar -xvzf nginx-1.18.0.tar.gz
[root@localhost ~]# cd nginx-1.18.0
#配置 需要安装监控模块
[root@localhost nginx-1.18.0]# ./configure --prefix=/usr/local/nginx --with-http_stub_status_module
#编译 安装
[root@localhost nginx-1.18.0]# make && make install
#检测安装是否有问题
[root@localhost nginx-1.18.0]# echo $?
0
#创建软连接 方便执行
[root@localhost nginx-1.18.0]# ln -s /usr/local/nginx/sbin/nginx /usr/sbin/
#配置监控模块
[root@localhost nginx-1.18.0]# vim /usr/local/nginx/conf/nginx.conf
location /nginx-status {
stub_status on;
}
[root@localhost nginx-1.18.0]# nginx
[root@localhost nginx-1.18.0]# systemctl stop firewalld
[root@localhost nginx-1.18.0]# setenforce 0
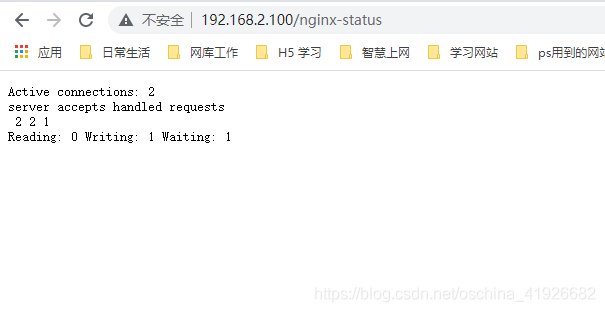
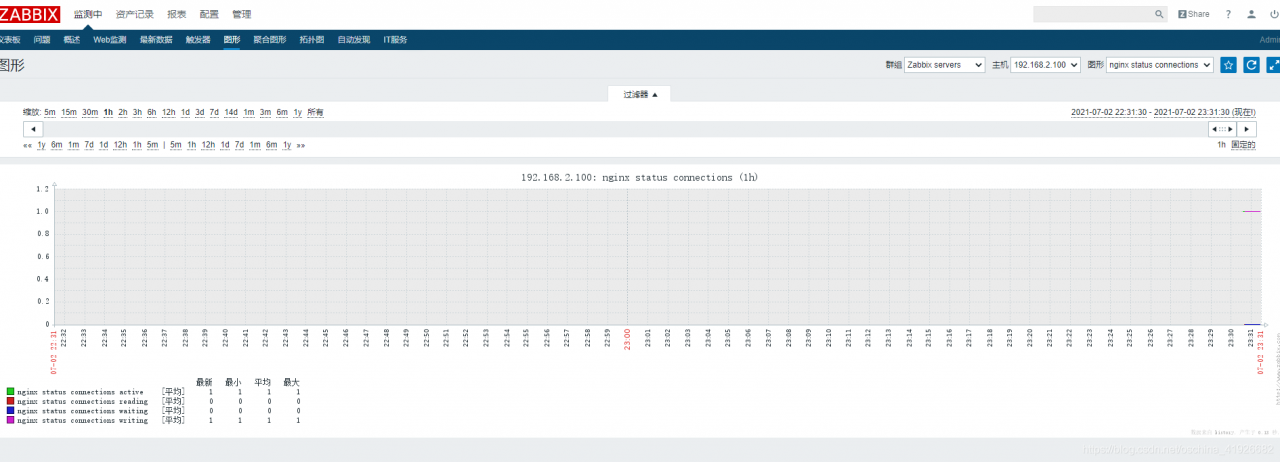
#http://192.168.2.100/nginx-status 访问网址查看监控信息
#Active connections 对后端发起的活动连接数
#nginx 总共处理了[accepts]个连接, 成功创建[handled]次握手,总共处理了[requests]个请求
#读取到客户端的Header信息数[Reading]: 0 返回给客户端的Header信息数[Writing]: 1 Waiting: 2
#waiting 开启 keep-alive 的情况下,这个值等于 active – (reading + writing),意思就是Nginx说已经处理完正在等候下一次请求指令的驻留连接
[root@localhost ~]# ls
anaconda-ks.cfg nginx-1.18.0 nginx-1.18.0.tar.gz zabbix-agent-3.2.11-1.el7.x86_64.rpm
[root@localhost ~]# rpm -ivh zabbix-agent-3.2.11-1.el7.x86_64.rpm
#编写脚本
[root@localhost ~]# cd /etc/zabbix/zabbix_agentd.d/
[root@localhost zabbix_agentd.d]# vim /etc/zabbix/zabbix_agentd.d/nginx-status.sh
#!/bin/bash
NGINX_HOST=192.168.2.100
NGINX_PORT=80
ping(){
netstat -lnt | grep "$NGINX_PORT" | wc -l
}
active(){
/usr/bin/curl -s "http://$NGINX_HOST:"$NGINX_PORT"/nginx-status/" |awk '/Active/ {print $NF}'
}
reading(){
/usr/bin/curl -s "http://$NGINX_HOST:"$NGINX_PORT"/nginx-status/" |awk '/Reading/ {print $2}'
}
writing(){
/usr/bin/curl -s "http://$NGINX_HOST:"$NGINX_PORT"/nginx-status/" |awk '/Writing/ {print $4}'
}
waiting(){
/usr/bin/curl -s "http://$NGINX_HOST:"$NGINX_PORT"/nginx-status/" |awk '/Waiting/ {print $6}'
}
accepts(){
/usr/bin/curl -s "http://$NGINX_HOST:"$NGINX_PORT"/nginx-status/" |awk 'NR==3 {print $1}'
}
handled(){
/usr/bin/curl -s "http://$NGINX_HOST:"$NGINX_PORT"/nginx-status/" |awk 'NR==3 {print $2}'
}
requests(){
/usr/bin/curl -s "http://$NGINX_HOST:"$NGINX_PORT"/nginx-status/" |awk 'NR==3 {print $3}'
}
$1
#授权
[root@localhost zabbix_agentd.d]# chmod a+x nginx-status.conf
#配置agent文件
[root@localhost zabbix_agentd.d]# vim /etc/zabbix/zabbix_agentd.conf
95 Server=192.168.2.10
136 ServerActive=192.168.2.10
147 Hostname=192.168.2.100
284 UnsafeUserParameters=1
293 UserParameter=nginx.status[*],/etc/zabbix/zabbix_agentd.d/nginx-status.sh $1
[root@localhost zabbix_agentd.d]# systemctl restart zabbix-agent
#zabbix-server端测试,能获取到客户端的监控数据 需要get包
[root@localhost fonts]# ls
graphfont.ttf simsun.ttf zabbix-get-3.2.11-1.el7.x86_64.rpm
[root@localhost fonts]# rpm -ivh zabbix-get-3.2.11-1.el7.x86_64.rpm
[root@localhost fonts]# zabbix_get -s 192.168.2.100 -k 'nginx.status[accepts]'
8
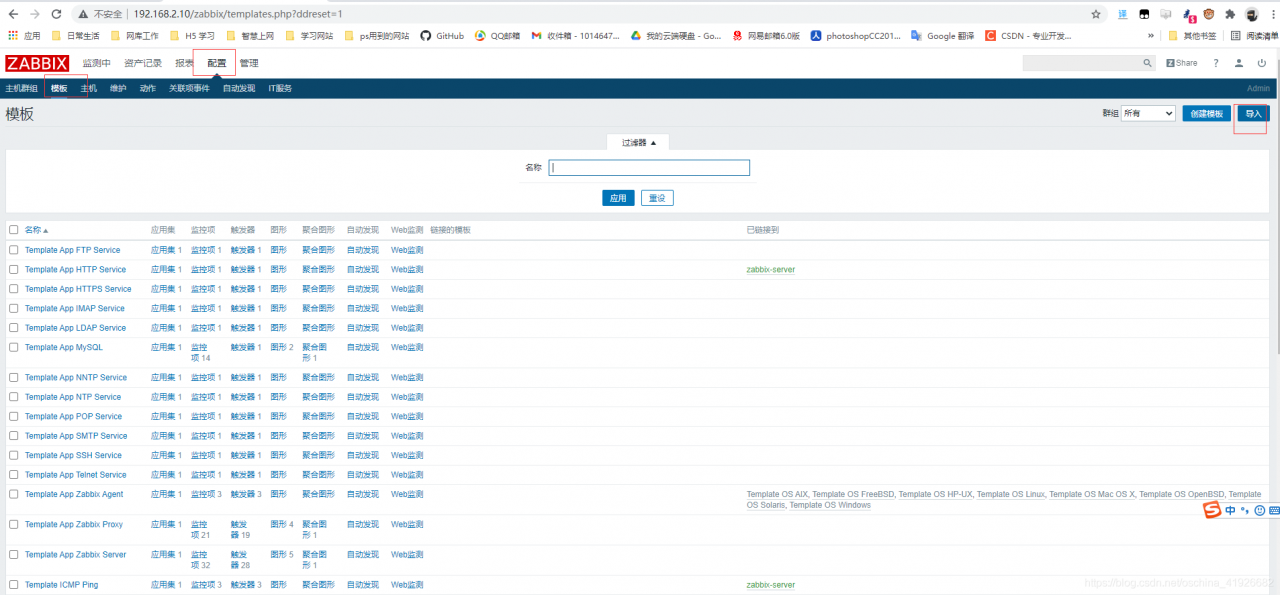
web界面:zabbix没有nginx模板 需要导入
主机==>模板==>导入==>选择文件(zbx_export_templates.xml)==>导入
zbx_export_templates.xml文件内容
<?xml version="1.0" encoding="UTF-8"?>
<zabbix_export>
<version>3.0</version>
<date>2015-10-25T01:29:50Z</date>
<groups>
<group>
<name>Templates</name>
</group>
</groups>
<templates>
<template>
<template>Template App NGINX</template>
<name>Template App NGINX Service</name>
<description>nginx监控模板</description>
<groups>
<group>
<name>Templates</name>
</group>
</groups>
<applications>
<application>
<name>nginx</name>
</application>
</applications>
<items>
<item>
<name>nginx status connections active</name>
<type>0</type>
<snmp_community/>
<multiplier>0</multiplier>
<snmp_oid/>
<key>nginx.status[active]</key>
<delay>60</delay>
<history>90</history>
<trends>365</trends>
<status>0</status>
<value_type>3</value_type>
<allowed_hosts/>
<units/>
<delta>0</delta>
<snmpv3_contextname/>
<snmpv3_securityname/>
<snmpv3_securitylevel>0</snmpv3_securitylevel>
<snmpv3_authprotocol>0</snmpv3_authprotocol>
<snmpv3_authpassphrase/>
<snmpv3_privprotocol>0</snmpv3_privprotocol>
<snmpv3_privpassphrase/>
<formula>1</formula>
<delay_flex/>
<params/>
<ipmi_sensor/>
<data_type>0</data_type>
<authtype>0</authtype>
<username/>
<password/>
<publickey/>
<privatekey/>
<port/>
<description>active</description>
<inventory_link>0</inventory_link>
<applications>
<application>
<name>nginx</name>
</application>
</applications>
<valuemap/>
<logtimefmt/>
</item>
<item>
<name>nginx status connections reading</name>
<type>0</type>
<snmp_community/>
<multiplier>0</multiplier>
<snmp_oid/>
<key>nginx.status[reading]</key>
<delay>60</delay>
<history>90</history>
<trends>365</trends>
<status>0</status>
<value_type>3</value_type>
<allowed_hosts/>
<units/>
<delta>0</delta>
<snmpv3_contextname/>
<snmpv3_securityname/>
<snmpv3_securitylevel>0</snmpv3_securitylevel>
<snmpv3_authprotocol>0</snmpv3_authprotocol>
<snmpv3_authpassphrase/>
<snmpv3_privprotocol>0</snmpv3_privprotocol>
<snmpv3_privpassphrase/>
<formula>1</formula>
<delay_flex/>
<params/>
<ipmi_sensor/>
<data_type>0</data_type>
<authtype>0</authtype>
<username/>
<password/>
<publickey/>
<privatekey/>
<port/>
<description>reading</description>
<inventory_link>0</inventory_link>
<applications>
<application>
<name>nginx</name>
</application>
</applications>
<valuemap/>
<logtimefmt/>
</item>
<item>
<name>nginx status connections waiting</name>
<type>0</type>
<snmp_community/>
<multiplier>0</multiplier>
<snmp_oid/>
<key>nginx.status[waiting]</key>
<delay>60</delay>
<history>90</history>
<trends>365</trends>
<status>0</status>
<value_type>3</value_type>
<allowed_hosts/>
<units/>
<delta>0</delta>
<snmpv3_contextname/>
<snmpv3_securityname/>
<snmpv3_securitylevel>0</snmpv3_securitylevel>
<snmpv3_authprotocol>0</snmpv3_authprotocol>
<snmpv3_authpassphrase/>
<snmpv3_privprotocol>0</snmpv3_privprotocol>
<snmpv3_privpassphrase/>
<formula>1</formula>
<delay_flex/>
<params/>
<ipmi_sensor/>
<data_type>0</data_type>
<authtype>0</authtype>
<username/>
<password/>
<publickey/>
<privatekey/>
<port/>
<description>waiting</description>
<inventory_link>0</inventory_link>
<applications>
<application>
<name>nginx</name>
</application>
</applications>
<valuemap/>
<logtimefmt/>
</item>
<item>
<name>nginx status connections writing</name>
<type>0</type>
<snmp_community/>
<multiplier>0</multiplier>
<snmp_oid/>
<key>nginx.status[writing]</key>
<delay>60</delay>
<history>90</history>
<trends>365</trends>
<status>0</status>
<value_type>3</value_type>
<allowed_hosts/>
<units/>
<delta>0</delta>
<snmpv3_contextname/>
<snmpv3_securityname/>
<snmpv3_securitylevel>0</snmpv3_securitylevel>
<snmpv3_authprotocol>0</snmpv3_authprotocol>
<snmpv3_authpassphrase/>
<snmpv3_privprotocol>0</snmpv3_privprotocol>
<snmpv3_privpassphrase/>
<formula>1</formula>
<delay_flex/>
<params/>
<ipmi_sensor/>
<data_type>0</data_type>
<authtype>0</authtype>
<username/>
<password/>
<publickey/>
<privatekey/>
<port/>
<description>writing</description>
<inventory_link>0</inventory_link>
<applications>
<application>
<name>nginx</name>
</application>
</applications>
<valuemap/>
<logtimefmt/>
</item>
<item>
<name>nginx status PING</name>
<type>0</type>
<snmp_community/>
<multiplier>0</multiplier>
<snmp_oid/>
<key>nginx.status[ping]</key>
<delay>60</delay>
<history>30</history>
<trends>365</trends>
<status>0</status>
<value_type>3</value_type>
<allowed_hosts/>
<units/>
<delta>0</delta>
<snmpv3_contextname/>
<snmpv3_securityname/>
<snmpv3_securitylevel>0</snmpv3_securitylevel>
<snmpv3_authprotocol>0</snmpv3_authprotocol>
<snmpv3_authpassphrase/>
<snmpv3_privprotocol>0</snmpv3_privprotocol>
<snmpv3_privpassphrase/>
<formula>1</formula>
<delay_flex/>
<params/>
<ipmi_sensor/>
<data_type>0</data_type>
<authtype>0</authtype>
<username/>
<password/>
<publickey/>
<privatekey/>
<port/>
<description>is live</description>
<inventory_link>0</inventory_link>
<applications>
<application>
<name>nginx</name>
</application>
</applications>
<valuemap>
<name>Service state</name>
</valuemap>
<logtimefmt/>
</item>
<item>
<name>nginx status server accepts</name>
<type>0</type>
<snmp_community/>
<multiplier>0</multiplier>
<snmp_oid/>
<key>nginx.status[accepts]</key>
<delay>60</delay>
<history>90</history>
<trends>365</trends>
<status>0</status>
<value_type>3</value_type>
<allowed_hosts/>
<units/>
<delta>1</delta>
<snmpv3_contextname/>
<snmpv3_securityname/>
<snmpv3_securitylevel>0</snmpv3_securitylevel>
<snmpv3_authprotocol>0</snmpv3_authprotocol>
<snmpv3_authpassphrase/>
<snmpv3_privprotocol>0</snmpv3_privprotocol>
<snmpv3_privpassphrase/>
<formula>1</formula>
<delay_flex/>
<params/>
<ipmi_sensor/>
<data_type>0</data_type>
<authtype>0</authtype>
<username/>
<password/>
<publickey/>
<privatekey/>
<port/>
<description>accepts</description>
<inventory_link>0</inventory_link>
<applications>
<application>
<name>nginx</name>
</application>
</applications>
<valuemap/>
<logtimefmt/>
</item>
<item>
<name>nginx status server handled</name>
<type>0</type>
<snmp_community/>
<multiplier>0</multiplier>
<snmp_oid/>
<key>nginx.status[handled]</key>
<delay>60</delay>
<history>90</history>
<trends>365</trends>
<status>0</status>
<value_type>3</value_type>
<allowed_hosts/>
<units/>
<delta>1</delta>
<snmpv3_contextname/>
<snmpv3_securityname/>
<snmpv3_securitylevel>0</snmpv3_securitylevel>
<snmpv3_authprotocol>0</snmpv3_authprotocol>
<snmpv3_authpassphrase/>
<snmpv3_privprotocol>0</snmpv3_privprotocol>
<snmpv3_privpassphrase/>
<formula>1</formula>
<delay_flex/>
<params/>
<ipmi_sensor/>
<data_type>0</data_type>
<authtype>0</authtype>
<username/>
<password/>
<publickey/>
<privatekey/>
<port/>
<description>handled</description>
<inventory_link>0</inventory_link>
<applications>
<application>
<name>nginx</name>
</application>
</applications>
<valuemap/>
<logtimefmt/>
</item>
<item>
<name>nginx status server requests</name>
<type>0</type>
<snmp_community/>
<multiplier>0</multiplier>
<snmp_oid/>
<key>nginx.status[requests]</key>
<delay>60</delay>
<history>90</history>
<trends>365</trends>
<status>0</status>
<value_type>3</value_type>
<allowed_hosts/>
<units/>
<delta>1</delta>
<snmpv3_contextname/>
<snmpv3_securityname/>
<snmpv3_securitylevel>0</snmpv3_securitylevel>
<snmpv3_authprotocol>0</snmpv3_authprotocol>
<snmpv3_authpassphrase/>
<snmpv3_privprotocol>0</snmpv3_privprotocol>
<snmpv3_privpassphrase/>
<formula>1</formula>
<delay_flex/>
<params/>
<ipmi_sensor/>
<data_type>0</data_type>
<authtype>0</authtype>
<username/>
<password/>
<publickey/>
<privatekey/>
<port/>
<description>requests</description>
<inventory_link>0</inventory_link>
<applications>
<application>
<name>nginx</name>
</application>
</applications>
<valuemap/>
<logtimefmt/>
</item>
</items>
<discovery_rules/>
<macros/>
<templates/>
<screens/>
</template>
</templates>
<triggers>
<trigger>
<expression>{Template App NGINX:nginx.status[ping].last()}=0</expression>
<name>nginx was down!</name>
<url/>
<status>0</status>
<priority>4</priority>
<description>NGINX进程数:0,请注意</description>
<type>0</type>
<dependencies/>
</trigger>
</triggers>
<graphs>
<graph>
<name>nginx status connections</name>
<width>900</width>
<height>200</height>
<yaxismin>0.0000</yaxismin>
<yaxismax>100.0000</yaxismax>
<show_work_period>1</show_work_period>
<show_triggers>1</show_triggers>
<type>0</type>
<show_legend>1</show_legend>
<show_3d>0</show_3d>
<percent_left>0.0000</percent_left>
<percent_right>0.0000</percent_right>
<ymin_type_1>0</ymin_type_1>
<ymax_type_1>0</ymax_type_1>
<ymin_item_1>0</ymin_item_1>
<ymax_item_1>0</ymax_item_1>
<graph_items>
<graph_item>
<sortorder>0</sortorder>
<drawtype>0</drawtype>
<color>00C800</color>
<yaxisside>0</yaxisside>
<calc_fnc>2</calc_fnc>
<type>0</type>
<item>
<host>Template App NGINX</host>
<key>nginx.status[active]</key>
</item>
</graph_item>
<graph_item>
<sortorder>1</sortorder>
<drawtype>0</drawtype>
<color>C80000</color>
<yaxisside>0</yaxisside>
<calc_fnc>2</calc_fnc>
<type>0</type>
<item>
<host>Template App NGINX</host>
<key>nginx.status[reading]</key>
</item>
</graph_item>
<graph_item>
<sortorder>2</sortorder>
<drawtype>0</drawtype>
<color>0000C8</color>
<yaxisside>0</yaxisside>
<calc_fnc>2</calc_fnc>
<type>0</type>
<item>
<host>Template App NGINX</host>
<key>nginx.status[waiting]</key>
</item>
</graph_item>
<graph_item>
<sortorder>3</sortorder>
<drawtype>0</drawtype>
<color>C800C8</color>
<yaxisside>0</yaxisside>
<calc_fnc>2</calc_fnc>
<type>0</type>
<item>
<host>Template App NGINX</host>
<key>nginx.status[writing]</key>
</item>
</graph_item>
</graph_items>
</graph>
<graph>
<name>nginx status server</name>
<width>900</width>
<height>200</height>
<yaxismin>0.0000</yaxismin>
<yaxismax>100.0000</yaxismax>
<show_work_period>1</show_work_period>
<show_triggers>1</show_triggers>
<type>0</type>
<show_legend>1</show_legend>
<show_3d>0</show_3d>
<percent_left>0.0000</percent_left>
<percent_right>0.0000</percent_right>
<ymin_type_1>0</ymin_type_1>
<ymax_type_1>0</ymax_type_1>
<ymin_item_1>0</ymin_item_1>
<ymax_item_1>0</ymax_item_1>
<graph_items>
<graph_item>
<sortorder>0</sortorder>
<drawtype>0</drawtype>
<color>00C800</color>
<yaxisside>0</yaxisside>
<calc_fnc>2</calc_fnc>
<type>0</type>
<item>
<host>Template App NGINX</host>
<key>nginx.status[accepts]</key>
</item>
</graph_item>
<graph_item>
<sortorder>1</sortorder>
<drawtype>0</drawtype>
<color>C80000</color>
<yaxisside>0</yaxisside>
<calc_fnc>2</calc_fnc>
<type>0</type>
<item>
<host>Template App NGINX</host>
<key>nginx.status[handled]</key>
</item>
</graph_item>
<graph_item>
<sortorder>2</sortorder>
<drawtype>0</drawtype>
<color>0000C8</color>
<yaxisside>0</yaxisside>
<calc_fnc>2</calc_fnc>
<type>0</type>
<item>
<host>Template App NGINX</host>
<key>nginx.status[requests]</key>
</item>
</graph_item>
</graph_items>
</graph>
</graphs>
</zabbix_export>
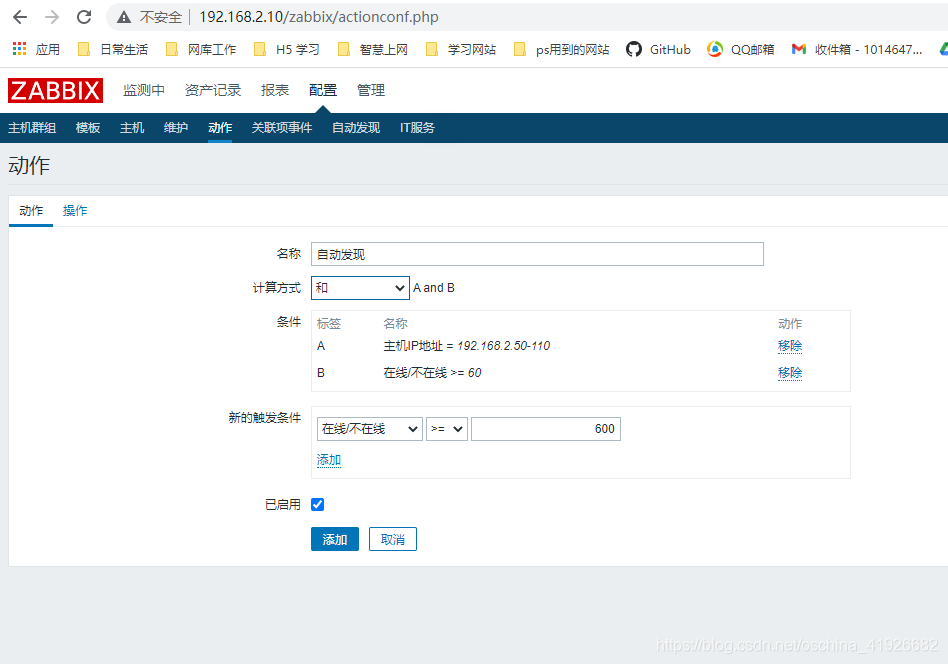
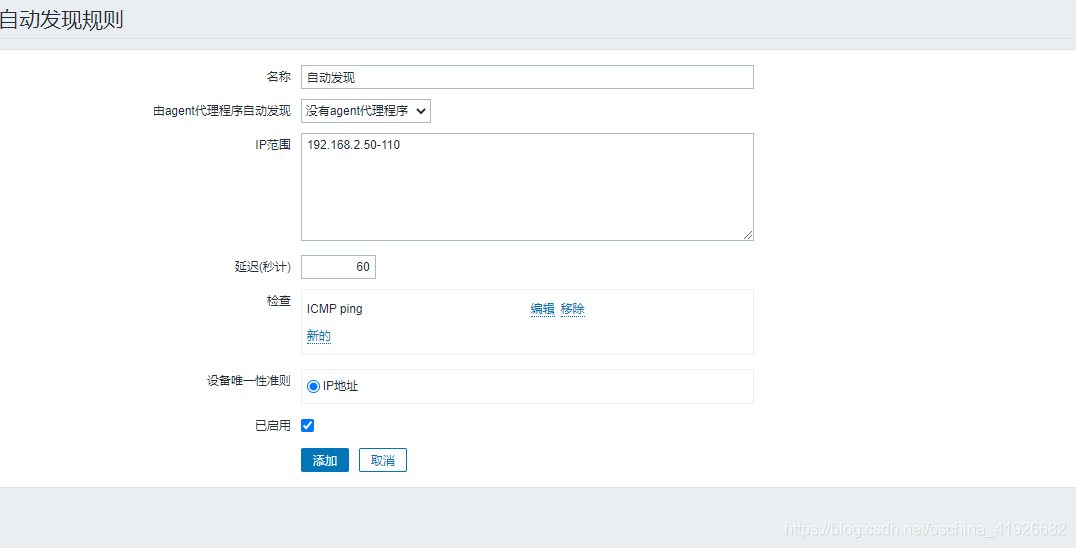
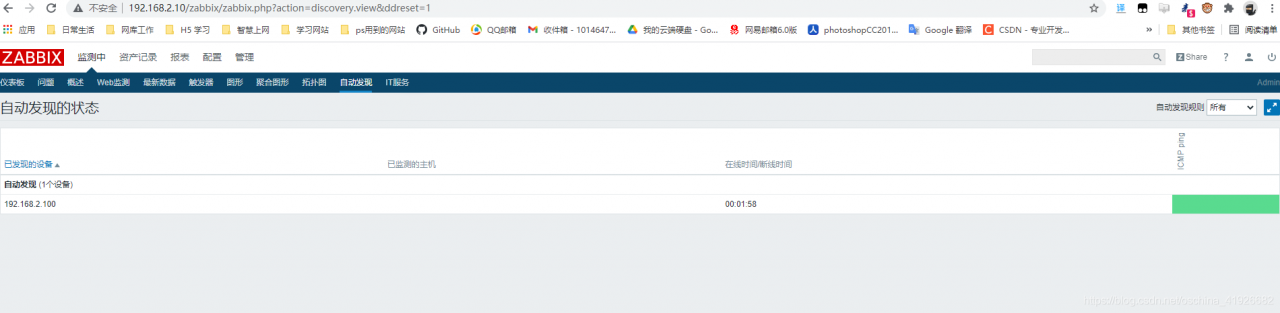
配置自动发现
配置==>动作==>自动发现==>创建动作==>名称 触发条件如图 计算方式和
操作==>操作内容如图==>添加
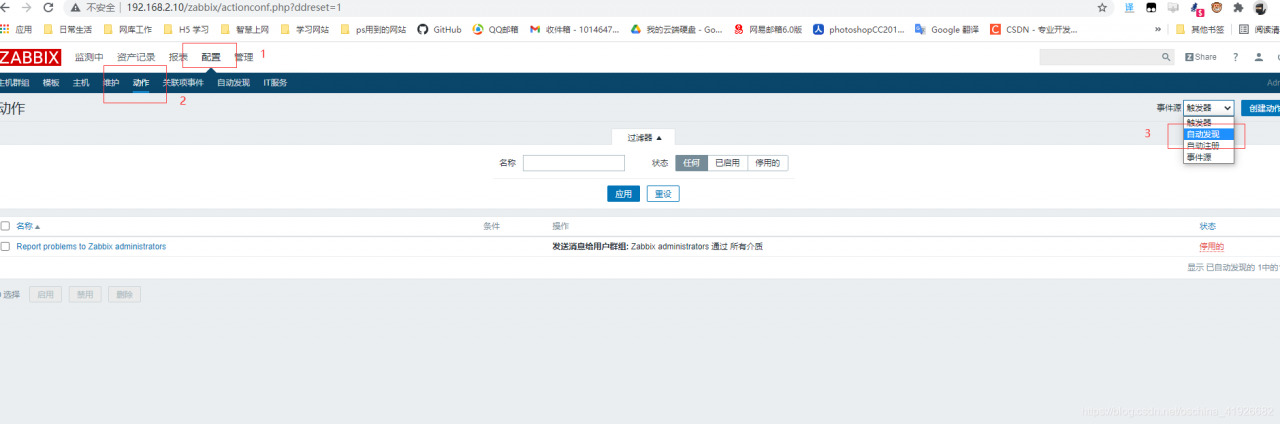

配置==>自动发现==>创建

版权声明:本文为oschina_41926682原创文章,遵循CC 4.0 BY-SA版权协议,转载请附上原文出处链接和本声明。