#1.获取系统cpu占有率的信息
import psutil
import time
#隔1s绘制cpu的占有率 -->持久化的保存
#如何将时间和对应的cpu占有率去匹配
while True:
    # 获取当前时间和cpu占有率
    t = time.localtime()
    cur_time = '%d:%d:%d' %(t.tm_hour,t.tm_min,t.tm_sec)
    cpu_res = psutil.cpu_percent()
    print(cpu_res)

    # 保存到文件中
    with open('cpu.txt','a+') as f:
        f.write('%s %s \n' %(cur_time,cpu_res))
    time.sleep(1)
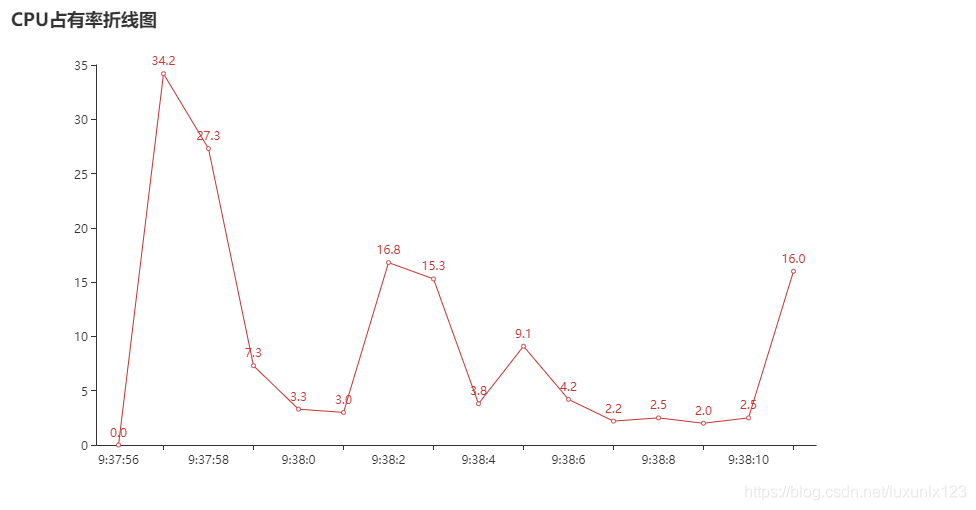
绘制CPU使用率折线图
import random
from pyecharts.charts import Line
import pyecharts.options as opts
#获取折线图需要的绘制的数据
x = []
y = []
with open('cpu.txt') as f: #以读的方式打开文件
    for line in f: #依次遍历文件的每一行内容
        time,per = line.split() # 返回时间和对应的cpu占有率
        x.append(time)
        y.append(per)
#添加对应的x和y的对应点
line = (
    Line()
    .add_xaxis(x)
    .add_yaxis('',y)
    .set_global_opts(title_opts=opts.TitleOpts(title='CPU占有率折线图'))

)
#将折线图信息保存早文件中
line.render()
版权声明:本文为luxunlx123原创文章,遵循CC 4.0 BY-SA版权协议,转载请附上原文出处链接和本声明。