如题, 分享一个在python中画柱状图的原代码, 其效果图如下:
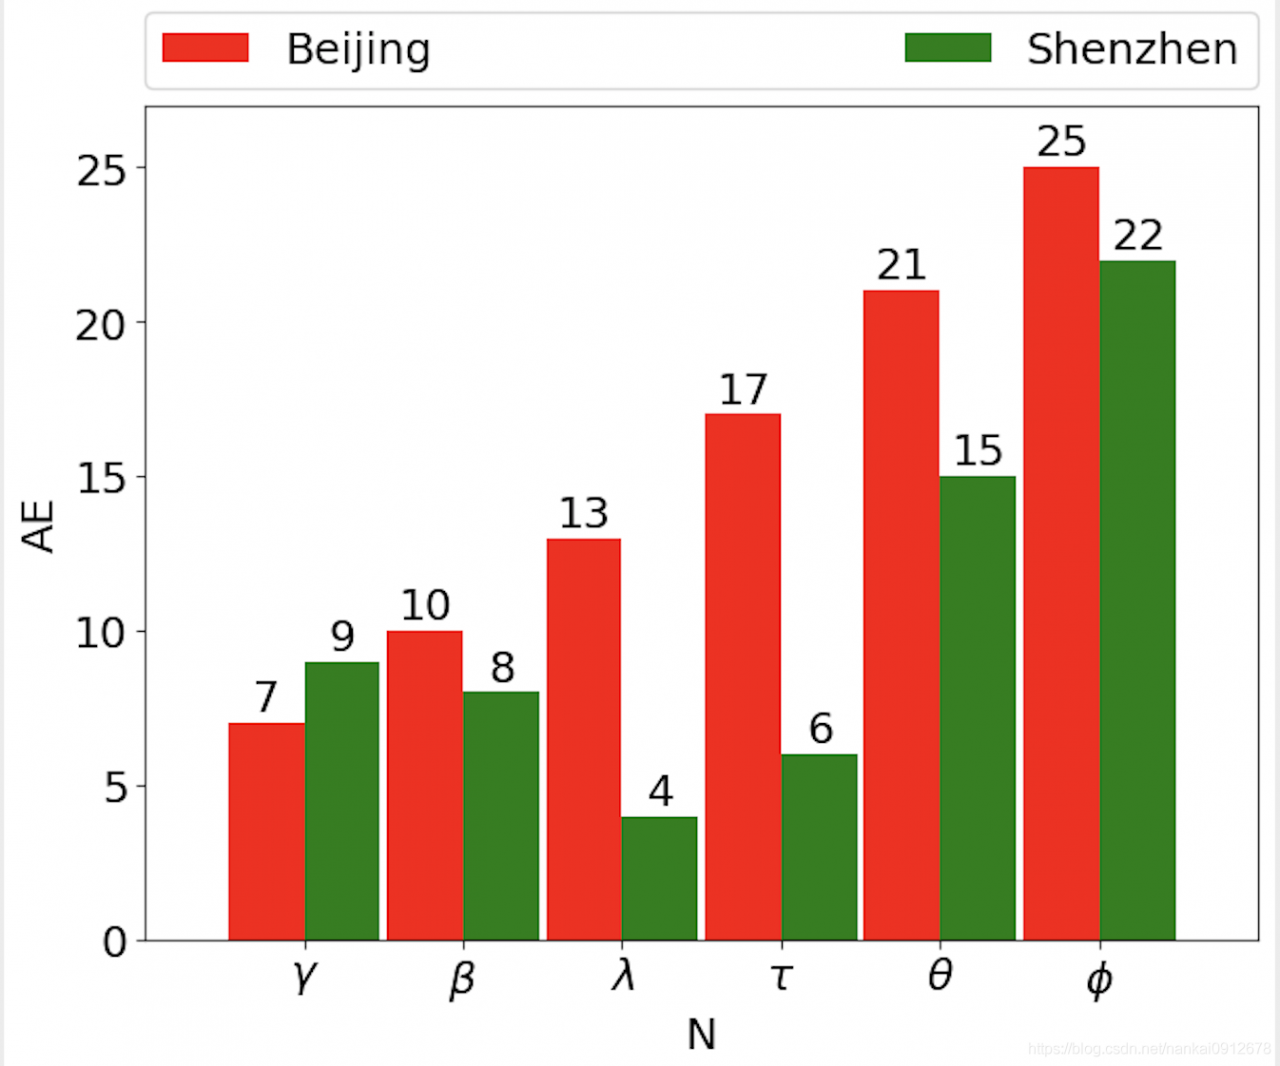
它的特点是:
- 有标签且标签在图片外侧
- 使用了希腊字母
- 在每个柱子上边标明了柱子的高度
原代码如下(建议用python3编译, 因为python2的编译结果会有所不同):
import json
import matplotlib.pyplot as plt
import matplotlib
from matplotlib.patches import Ellipse
import numpy as np

font = {'size':18}
matplotlib.rc('font', **font)


if __name__ == "__main__":
	AE1 = [7, 10, 13, 17, 21, 25]
	AE2 = [9, 8, 4, 6, 15, 22]

	fig = plt.figure(1)
	ax = fig.add_axes([0,0,1,1])
	ax.set_xlim([0,7])
	ax.set_ylim([0,27])
	plt.xlabel("N")
	plt.ylabel("AE")
	plt.xticks(range(1, 7), [r"$\gamma$", r"$\beta$", r"$\lambda$", r"$\tau$", r"$\theta$", r"$\phi$"])
	rects = ax.patches
	labels1 = [str(item) for item in AE1]
	labels2 = [str(item) for item in AE2]
	plt.bar(np.arange(1, 7) - 0.24, AE1, label = "Beijing", color = 'red', width = 0.48)
	plt.bar(np.arange(1, 7) + 0.24, AE2, label = "Shenzhen", color = 'green', width = 0.48)
	for x, y, label in zip(np.arange(1, 7) - 0.24, AE1, labels1):
		ax.text(x, y + 0.1, label,ha='center', va='bottom')
	for x, y, label in zip(np.arange(1, 7) + 0.24, AE2, labels2):
		ax.text(x, y + 0.1, label,ha='center', va='bottom')
	plt.legend(bbox_to_anchor=(0.0, 1.02, 1.0, 0.102), loc = 3, ncol = 2, mode = "expand", borderaxespad = 0.0)
	plt.savefig("AE.pdf", bbox_inches = "tight")
	plt.savefig("AE.png", bbox_inches = "tight")
版权声明:本文为nankai0912678原创文章,遵循CC 4.0 BY-SA版权协议,转载请附上原文出处链接和本声明。