目录
1.1、建议将所有的prometheus yaml文件存在一块
1.8、创建rbac认证,因为prometheus需要访问k8s集群内部的资源
1.10、将ConfigMap volume rbac 创建完毕后,就可以创建prometheus_deploy
3.6、使用NodeIP+NodePort访问grafana web界面
环境说明
| 主机IP | 角色 |
| 192.168.126.111 (kmaster) | master |
| 192.168.126.112 (knode1) | node1 |
| 192.168.126.113 (knode2) | node2 |
| 192.168.126.114 (knode3) | node3 |
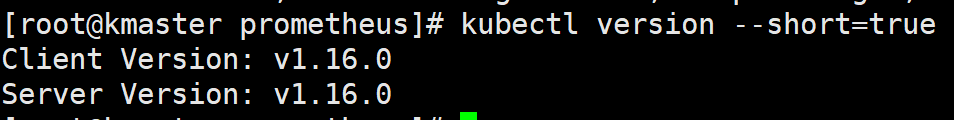
查看k8s版本
安装过程中的文件:
Kubernetes1.16下部署Prometheus+node-exporter+Grafana监_Attachments.zip-kubernetes文档类资源-CSDN下载
一、Prometheus 持久化安装
我们prometheus采用nfs挂载方式来存储数据,同时使用configMap管理配置文件。并且我们将所有的prometheus存储在kube-system
1.1、建议将所有的prometheus yaml文件存在一块
mkdir /app/prometheus -p && cd /app/prometheus
![]()
1.2、生成配置文件
cat >> prometheus.configmap.yaml <<EOF
apiVersion: v1
kind: ConfigMap
metadata:
name: prometheus-config
namespace: kube-system
data:
prometheus.yml: |
global:
scrape_interval: 15s
scrape_timeout: 15s
scrape_configs:
- job_name: 'prometheus'
static_configs:
- targets: ['localhost:9090']
EOF
1.3、创建资源
[root@kmaster prometheus]# kubectl apply -f prometheus.configmap.yaml
configmap/prometheus-config created
[root@kmaster prometheus]# kubectl get configmaps -n kube-system |grep prometheus

1.4、创建prometheus的Pod资源
[root@k8s-01 prometheus]# cat > prometheus.deploy.yaml <<EOF
apiVersion: apps/v1
kind: Deployment
metadata:
name: prometheus
namespace: kube-system
labels:
app: prometheus
spec:
selector:
matchLabels:
app: prometheus
template:
metadata:
labels:
app: prometheus
spec:
serviceAccountName: prometheus
containers:
- image: prom/prometheus:v2.4.3
name: prometheus
command:
- "/bin/prometheus"
args:
- "--config.file=/etc/prometheus/prometheus.yml"
- "--storage.tsdb.path=/prometheus"
- "--storage.tsdb.retention=30d"
- "--web.enable-admin-api" # 控制对admin HTTP API的访问,其中包括删除时间序列等功能
- "--web.enable-lifecycle" # 支持热更新,直接执行localhost:9090/-/reload立即生效
ports:
- containerPort: 9090
protocol: TCP
name: http
volumeMounts:
- mountPath: "/prometheus"
subPath: prometheus
name: data
- mountPath: "/etc/prometheus"
name: config-volume
resources:
requests:
cpu: 100m
memory: 512Mi
limits:
cpu: 100m
memory: 512Mi
securityContext:
runAsUser: 0
volumes:
- name: data
persistentVolumeClaim:
claimName: prometheus
- configMap:
name: prometheus-config
name: config-volume
---
apiVersion: v1
kind: Service
metadata:
namespace: kube-system
name: prometheus
labels:
app: prometheus
spec:
type: NodePort
selector:
app: prometheus
ports:
- name: http
port: 9090
EOF
我们在启动程序的时候,除了指定prometheus.yaml(configmap)以外,还通过storage.tsdb.path指定了TSDB数据的存储路径、通过storage.tsdb.rentention设置了保留多长时间的数据,还有下面的web.enable-admin-api参数可以用来开启对admin api的访问权限,
参数web.enable-lifecyle用来开启支持热更新,有了这个参数之后,prometheus.yaml(configmap)文件只要更新了,通过执行localhost:9090/-/reload就会立即生效
我们添加了一行securityContext,,其中runAsUser设置为0,这是因为prometheus运行过程中使用的用户是nobody,如果不配置可能会出现权限问题
1.5、nfs服务部署
[root@kmaster prometheus]# yum install nfs-utils rpcbind -y
1.6、NFS服务器操作如下
[root@kmaster prometheus]# mkdir -p /app/k8s
[root@kmaster prometheus]# systemctl start rpcbind
[root@kmaster prometheus]# systemctl enable rpcbind
[root@kmaster prometheus]# systemctl start nfs
[root@kmaster prometheus]# systemctl enable nfs
[root@kmaster prometheus]# echo "/app/k8s 192.168.126.0/24(rw,no_root_squash,sync)" >>/etc/exports
[root@kmaster prometheus]# exportfs -r #使配置生效
1.7、创建prometheus-volume文件
[root@kmaster prometheus]# cat >prometheus-volume.yaml <<EOF
apiVersion: v1
kind: PersistentVolume
metadata:
name: prometheus
spec:
capacity:
storage: 10Gi
accessModes:
- ReadWriteOnce
persistentVolumeReclaimPolicy: Recycle
nfs:
server: 192.168.126.111
path: /app/k8s
---
apiVersion: v1
kind: PersistentVolumeClaim
metadata:
name: prometheus
namespace: kube-system
spec:
accessModes:
- ReadWriteOnce
resources:
requests:
storage: 10Gi
EOF
这里通过一个简单的NFS作为存储后端创建一个pv & pvc
[root@kmaster prometheus]# kubectl create -f prometheus-volume.yaml
persistentvolume/prometheus created
persistentvolumeclaim/prometheus created
1.8、创建rbac认证,因为prometheus需要访问k8s集群内部的资源
[root@kmaster prometheus]# cat >>prometheus-rbac.yaml <<EOF
apiVersion: v1
kind: ServiceAccount
metadata:
name: prometheus
namespace: kube-system
---
apiVersion: rbac.authorization.k8s.io/v1
kind: ClusterRole
metadata:
name: prometheus
rules:
- apiGroups:
- ""
resources:
- nodes
- services
- endpoints
- pods
- nodes/proxy
verbs:
- get
- list
- watch
- apiGroups:
- ""
resources:
- configmaps
- nodes/metrics
verbs:
- get
- nonResourceURLs:
- /metrics
verbs:
- get
---
apiVersion: rbac.authorization.k8s.io/v1beta1
kind: ClusterRoleBinding
metadata:
name: prometheus
roleRef:
apiGroup: rbac.authorization.k8s.io
kind: ClusterRole
name: prometheus
subjects:
- kind: ServiceAccount
name: prometheus
namespace: kube-system
EOF
1.9、创建rbac文件
[root@kmaster prometheus]# kubectl create -f prometheus-rbac.yaml
serviceaccount/prometheus created
clusterrole.rbac.authorization.k8s.io/prometheus created
clusterrolebinding.rbac.authorization.k8s.io/prometheus created
1.10、将ConfigMap volume rbac 创建完毕后,就可以创建prometheus_deploy
[root@kmaster prometheus]# kubectl create -f prometheus.deploy.yaml
deployment.extensions/prometheus created
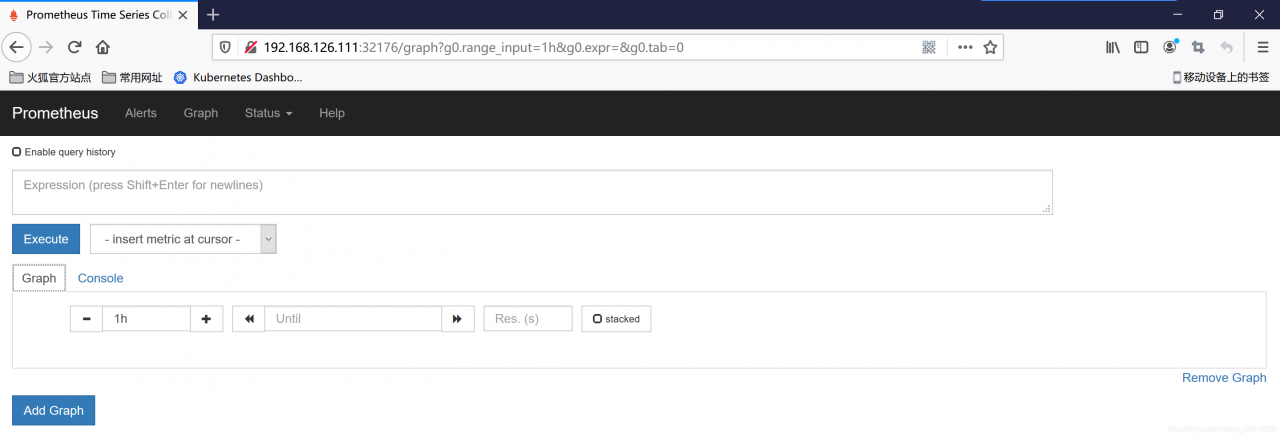
1.11、登录prometheus web界面查看
通过一下命令查询service端口
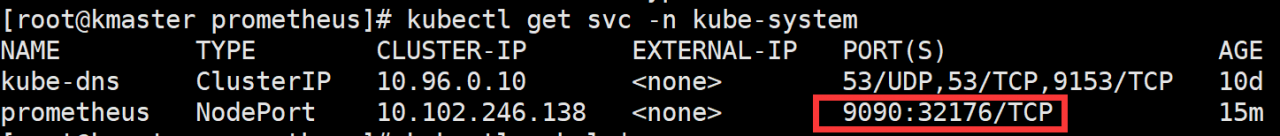
浏览器中输入IP+NodePort
二、监控集群节点
首先需要我们监控集群的节点,要监控节点其实我们已经有很多非常成熟的方案了,比如Nagios、Zabbix,甚至可以我们自己收集数据,这里我们通过prometheus来采集节点的监控指标,可以通过node_exporter获取,node_exporter就是抓取用于采集服务器节点的各种运行指标,目前node_exporter几乎支持所有常见的监控点,比如cpu、distats、loadavg、meminfo、netstat等,详细的监控列表可以参考github repo
这里使用DeamonSet控制器来部署该服务,这样每一个节点都会运行一个Pod,如果我们从集群中删除或添加节点后,也会进行自动扩展
[root@kmaster prometheus]# cat >>prometheus-node-exporter.yaml<<EOF
apiVersion: apps/v1
kind: DaemonSet
metadata:
name: node-exporter
namespace: kube-system
labels:
name: node-exporter
k8s-app: node-exporter
spec:
selector:
matchLabels:
name: node-exporter
template:
metadata:
labels:
name: node-exporter
app: node-exporter
spec:
hostPID: true
hostIPC: true
hostNetwork: true
containers:
- name: node-exporter
image: prom/node-exporter:v0.16.0
ports:
- containerPort: 9100
resources:
requests:
cpu: 0.15
securityContext:
privileged: true
args:
- --path.procfs
- /host/proc
- --path.sysfs
- /host/sys
- --collector.filesystem.ignored-mount-points
- '"^/(sys|proc|dev|host|etc)($|/)"'
volumeMounts:
- name: dev
mountPath: /host/dev
- name: proc
mountPath: /host/proc
- name: sys
mountPath: /host/sys
- name: rootfs
mountPath: /rootfs
tolerations:
- key: "node-role.kubernetes.io/master"
operator: "Exists"
effect: "NoSchedule" # 使node_exporter可以调度到master节点
volumes:
- name: proc
hostPath:
path: /proc
- name: dev
hostPath:
path: /dev
- name: sys
hostPath:
path: /sys
- name: rootfs
hostPath:
path: /
EOF
2.1、创建node-exporter
[root@kmaster prometheus]# kubectl create -f prometheus-node-exporter.yaml
daemonset.extensions/node-exporter created
2.2、查看node-exporter的pod
[root@kmaster prometheus]# kubectl get pod -n kube-system -o wide|grep node-exporter

2.3、更新prometheus configmap文件
[root@kmaster prometheus]# cat prometheus.configmap.1.yaml
apiVersion: v1
kind: ConfigMap
metadata:
name: prometheus-config
namespace: kube-system
annotations:
prometheus.io/port: "9153"
prometheus.io/scrape: "true"
data:
prometheus.yml: |
global:
scrape_interval: 15s
scrape_timeout: 15s
scrape_configs:
- job_name: 'prometheus'
static_configs:
- targets: ['localhost:9090']
- job_name: 'kubernetes-node'
kubernetes_sd_configs:
- role: node
relabel_configs:
- source_labels: [__address__]
regex: '(.*):10250'
replacement: '${1}:9100'
target_label: __address__
action: replace
- action: labelmap
regex: __meta_kubernetes_node_label_(.+)
- job_name: 'kubernetes-cadvisor'
kubernetes_sd_configs:
- role: node
scheme: https
tls_config:
ca_file: /var/run/secrets/kubernetes.io/serviceaccount/ca.crt
bearer_token_file: /var/run/secrets/kubernetes.io/serviceaccount/token
relabel_configs:
- action: labelmap
regex: __meta_kubernetes_node_label_(.+)
- target_label: __address__
replacement: kubernetes.default.svc:443
- source_labels: [__meta_kubernetes_node_name]
regex: (.+)
target_label: __metrics_path__
replacement: /api/v1/nodes/${1}/proxy/metrics/cadvisor
- job_name: kubernetes-apiservers
kubernetes_sd_configs:
- role: endpoints
relabel_configs:
- action: keep
regex: default;kubernetes;https
source_labels:
- __meta_kubernetes_namespace
- __meta_kubernetes_service_name
- __meta_kubernetes_endpoint_port_name
scheme: https
tls_config:
ca_file: /var/run/secrets/kubernetes.io/serviceaccount/ca.crt
insecure_skip_verify: true
bearer_token_file: /var/run/secrets/kubernetes.io/serviceaccount/token
- job_name: 'kubernetes-service-endpoints'
kubernetes_sd_configs:
- role: endpoints
relabel_configs:
- source_labels: [__meta_kubernetes_service_annotation_prometheus_io_scrape]
action: keep
regex: true
- source_labels: [__meta_kubernetes_service_annotation_prometheus_io_scheme]
action: replace
target_label: __scheme__
regex: (https?)
- source_labels: [__meta_kubernetes_service_annotation_prometheus_io_path]
action: replace
target_label: __metrics_path__
regex: (.+)
- source_labels: [__address__, __meta_kubernetes_service_annotation_prometheus_io_port]
action: replace
target_label: __address__
regex: ([^:]+)(?::\d+)?;(\d+)
replacement: $1:$2
- action: labelmap
regex: __meta_kubernetes_service_label_(.+)
- source_labels: [__meta_kubernetes_namespace]
action: replace
target_label: kubernetes_namespace
- source_labels: [__meta_kubernetes_service_name]
action: replace
target_label: kubernetes_name
2.4、刷新配置
[root@kmaster prometheus]# kubectl apply -f prometheus.configmap.yaml
configmap/prometheus-config unchanged
[root@kmaster prometheus]# curl -X POST http://10.102.246.138:9090/-/reload
[root@kmaster prometheus]# curl -X POST http://10.102.246.138:9090/-/reload
[root@kmaster prometheus]# curl -X POST http://10.102.246.138:9090/-/reload
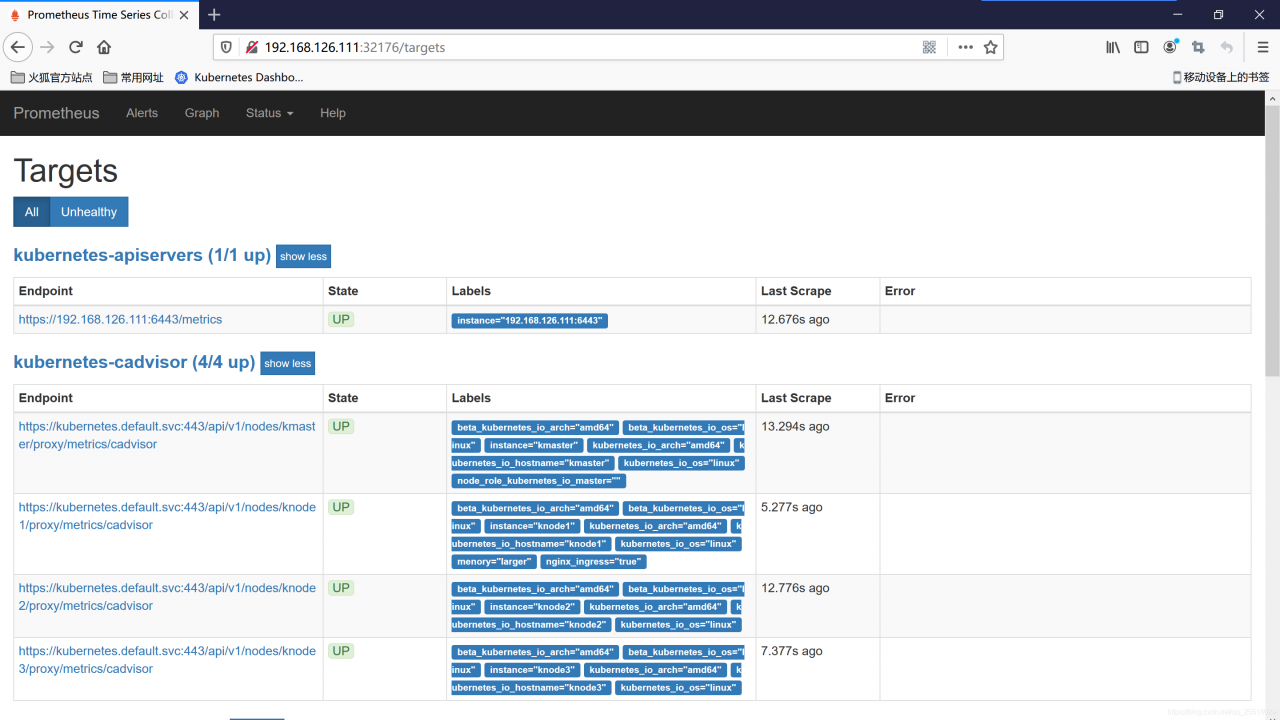
2.5、查看状态
三、Grafana 安装并监控k8s集群
3.1、使用deployment持久化安装grafana
cat >>grafana_deployment.yaml <<EOF
apiVersion: apps/v1
kind: Deployment
metadata:
name: grafana
namespace: kube-system
labels:
app: grafana
k8s-app: grafana
spec:
selector:
matchLabels:
k8s-app: grafana
app: grafana
revisionHistoryLimit: 10
template:
metadata:
labels:
app: grafana
k8s-app: grafana
spec:
containers:
- name: grafana
image: grafana/grafana:5.3.4
imagePullPolicy: IfNotPresent
ports:
- containerPort: 3000
name: grafana
env:
- name: GF_SECURITY_ADMIN_USER
value: admin
- name: GF_SECURITY_ADMIN_PASSWORD
value: 12345@com
readinessProbe:
failureThreshold: 10
httpGet:
path: /api/health
port: 3000
scheme: HTTP
initialDelaySeconds: 60
periodSeconds: 10
successThreshold: 1
timeoutSeconds: 30
livenessProbe:
failureThreshold: 3
httpGet:
path: /api/health
port: 3000
scheme: HTTP
periodSeconds: 10
successThreshold: 1
timeoutSeconds: 1
resources:
limits:
cpu: 300m
memory: 1024Mi
requests:
cpu: 300m
memory: 1024Mi
volumeMounts:
- mountPath: /var/lib/grafana
subPath: grafana
name: storage
securityContext:
fsGroup: 472
runAsUser: 472
volumes:
- name: storage
persistentVolumeClaim:
claimName: grafana
EOF
这里使用了grafana 5.3.4的镜像,添加了监控检查、资源声明,比较重要的变量是GF_SECURITY_ADMIN_USER和GF_SECURITY_ADMIN_PASSWORD为grafana的账号和密码
由于grafana将dashboard、插件这些数据保留在/var/lib/grafana目录下,所以我们这里需要做持久化,同时要针对这个目录做挂载声明;由于5.3.4版本用户的userid和groupid都有所变化,所以这里添加了一个securityContext设置用户ID
3.2、添加一个pv和pvc用于绑定grafana
cat >>grafana_volume.yaml <<EOF
apiVersion: v1
kind: PersistentVolume
metadata:
name: grafana
spec:
capacity:
storage: 10Gi
accessModes:
- ReadWriteOnce
persistentVolumeReclaimPolicy: Recycle
nfs:
server: 192.168.126.111
path: /app/k8s
---
apiVersion: v1
kind: PersistentVolumeClaim
metadata:
name: grafana
namespace: kube-system
spec:
accessModes:
- ReadWriteOnce
resources:
requests:
storage: 10Gi
EOF
3.3、创建一个service,使用NodePort
cat >>grafana_svc.yaml<<EOF
apiVersion: v1
kind: Service
metadata:
name: grafana
namespace: kube-system
labels:
app: grafana
spec:
type: NodePort
ports:
- port: 3000
selector:
app: grafana
EOF
由于5.1(可以选择5.1之前的docker镜像,可以避免此类错误)版本后groupid更改,同时我们将/var/lib/grafana挂载到pvc后,目录拥有者可能不是grafana用户,所以我们还需要添加一个Job用于授权目录
cat > grafana_job.yaml <<EOF
apiVersion: batch/v1
kind: Job
metadata:
name: grafana-chown
namespace: kube-system
spec:
template:
spec:
restartPolicy: Never
containers:
- name: grafana-chown
command: ["chown", "-R", "472:472", "/var/lib/grafana"]
image: busybox
imagePullPolicy: IfNotPresent
volumeMounts:
- name: storage
subPath: grafana
mountPath: /var/lib/grafana
volumes:
- name: storage
persistentVolumeClaim:
claimName: grafana
EOF
使用一个busybox镜像将/var/lib/grafana目录修改为权限472
3.4、创建pv和pvc (这里是需要按照顺序来创建)
[root@kmaster prometheus]# kubectl create -f grafana_volume.yaml
persistentvolume/grafana created
persistentvolumeclaim/grafana created
[root@kmaster prometheus]# kubectl create -f grafana_job.yaml
job.batch/grafana-chown created
[root@kmaster prometheus]# kubectl apply -f grafana_deployment.yaml
deployment.apps/grafana created
[root@kmaster prometheus]# kubectl create -f grafana_svc.yaml
3.5、查看创建结果
[root@kmaster prometheus]# kubectl get pod,svc -n kube-system |grep grafana

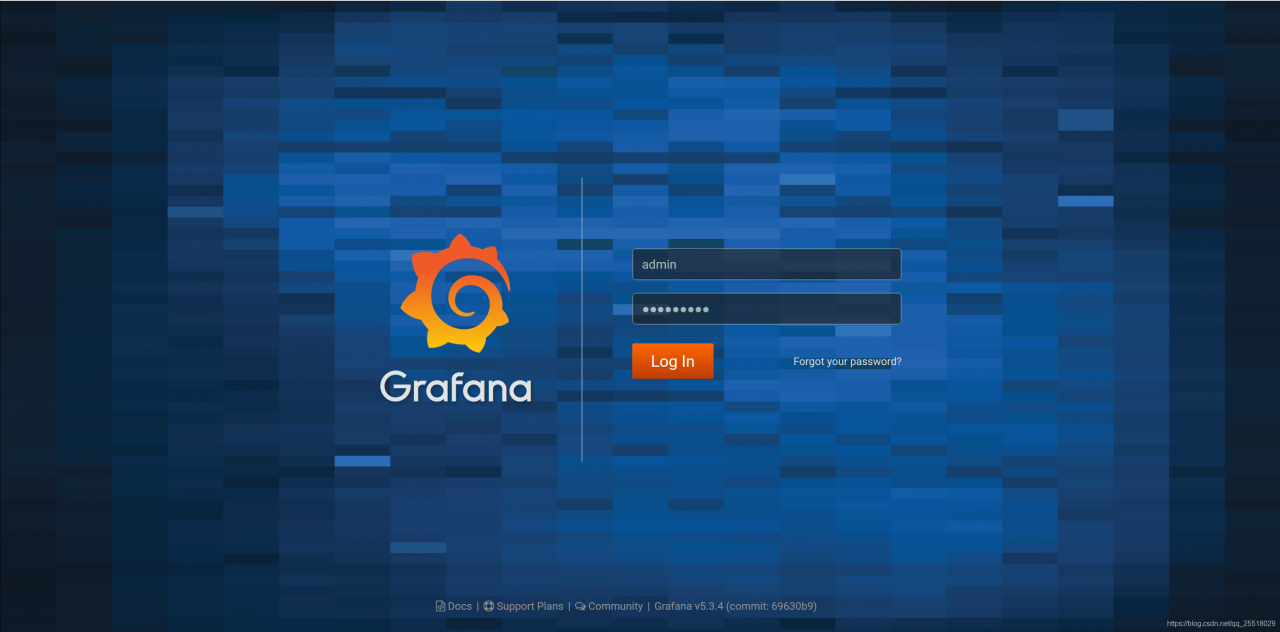
3.6、使用NodeIP+NodePort访问grafana web界面
http://192.168.126.111:30183
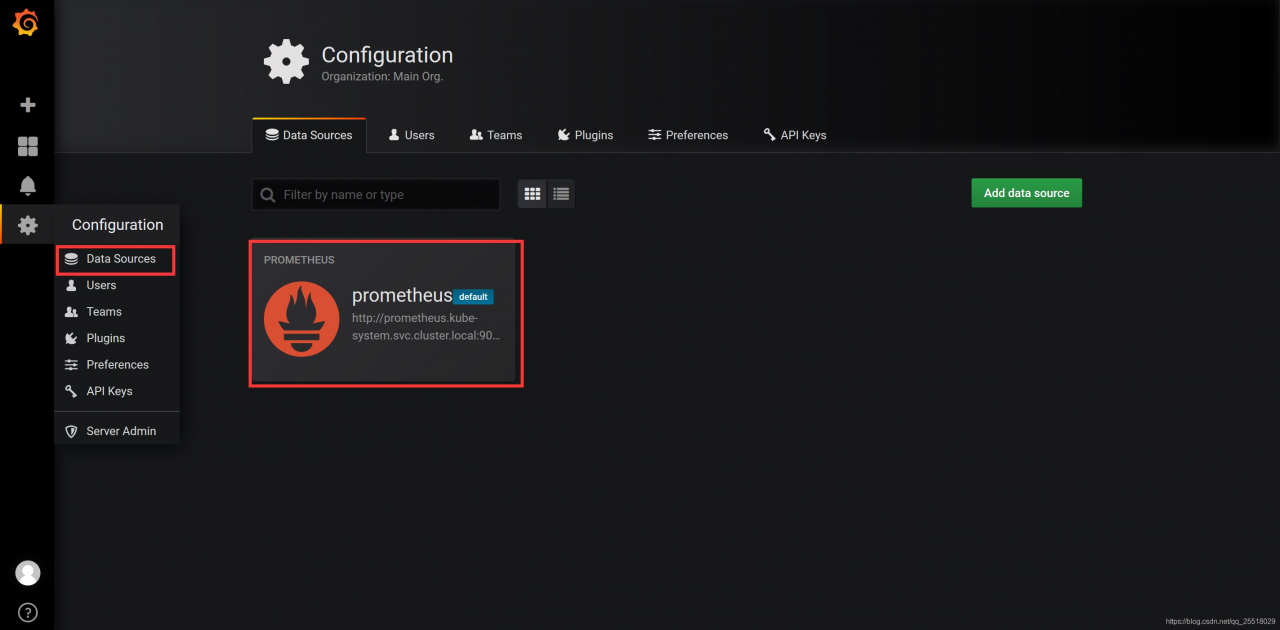
3.7、第一次创建grafana需要添加数据源
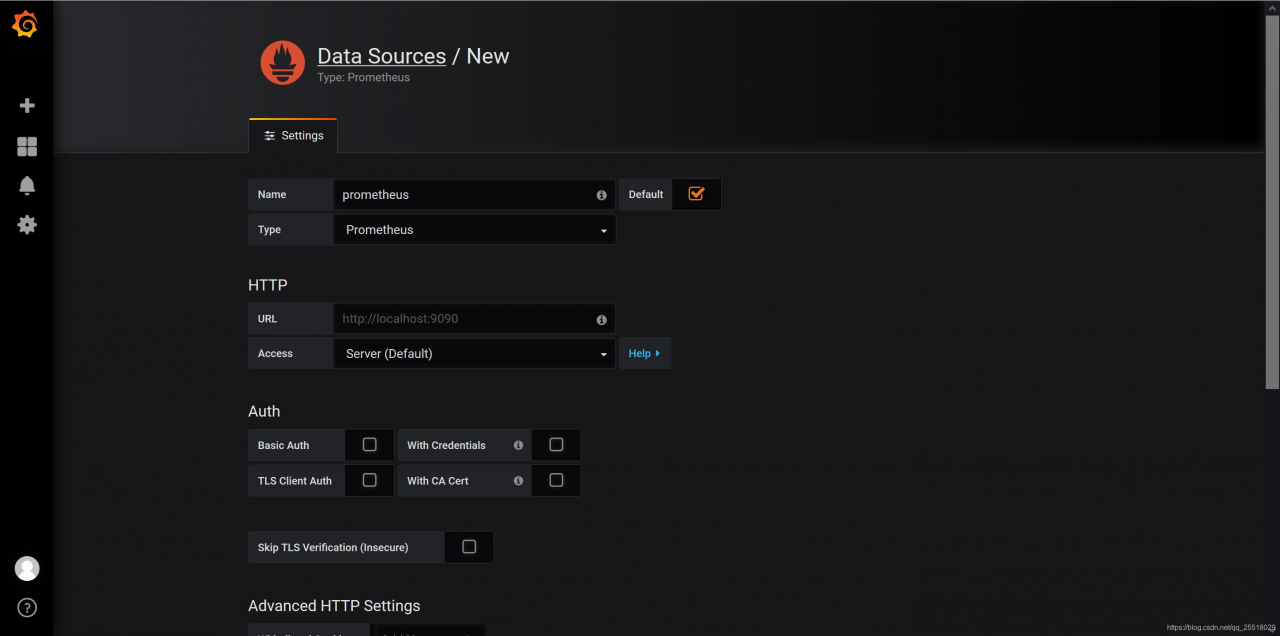
url填写:http://prometheus.kube-system.svc.cluster.local:9090
数据源添加完毕后,接下来添加New dashboard
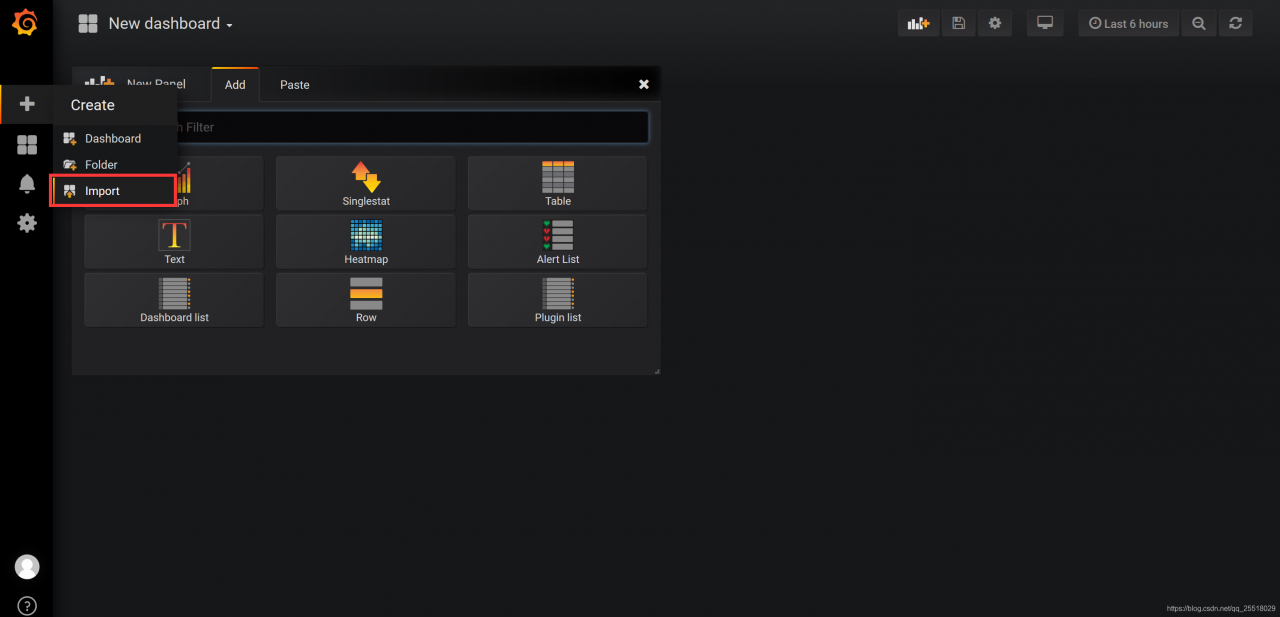
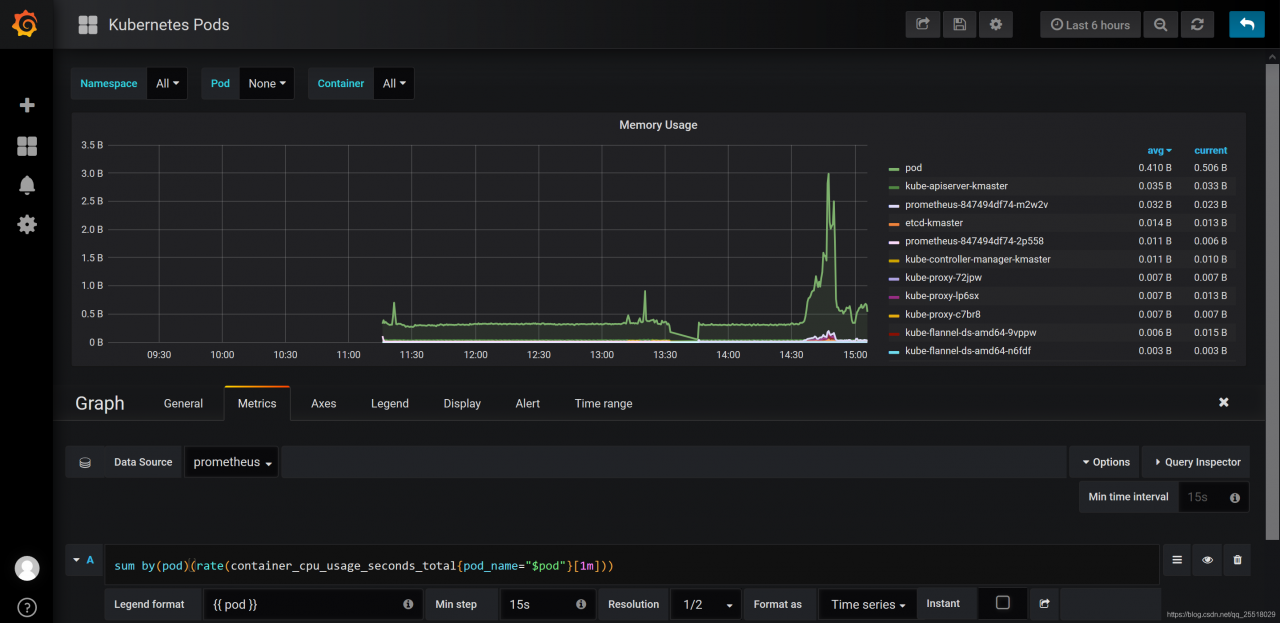
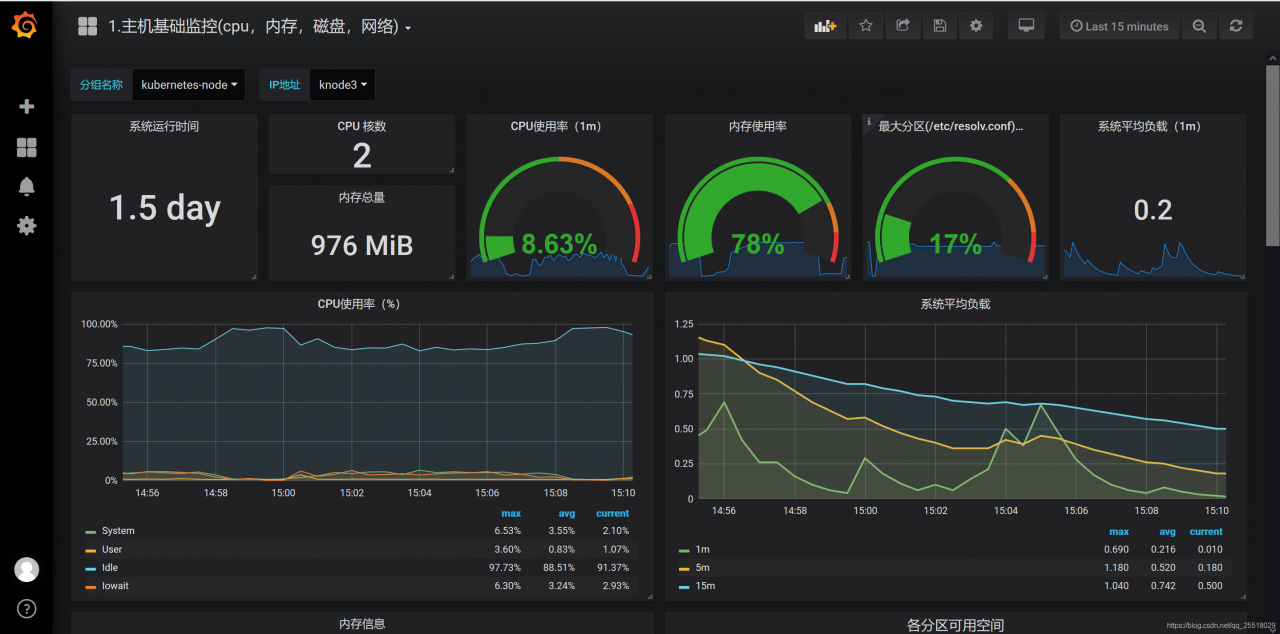
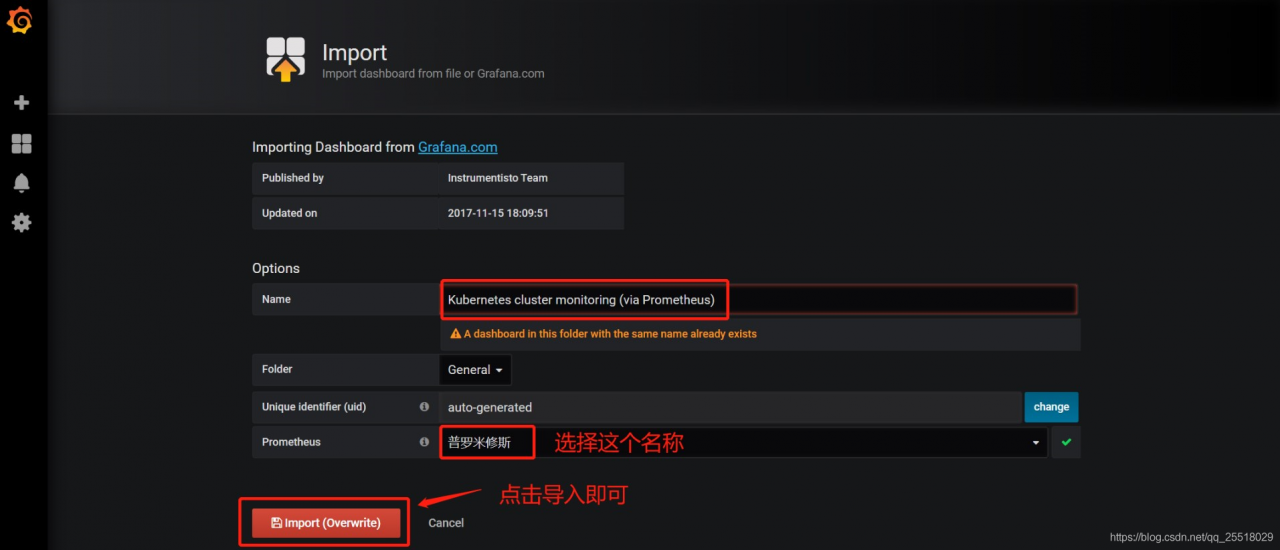
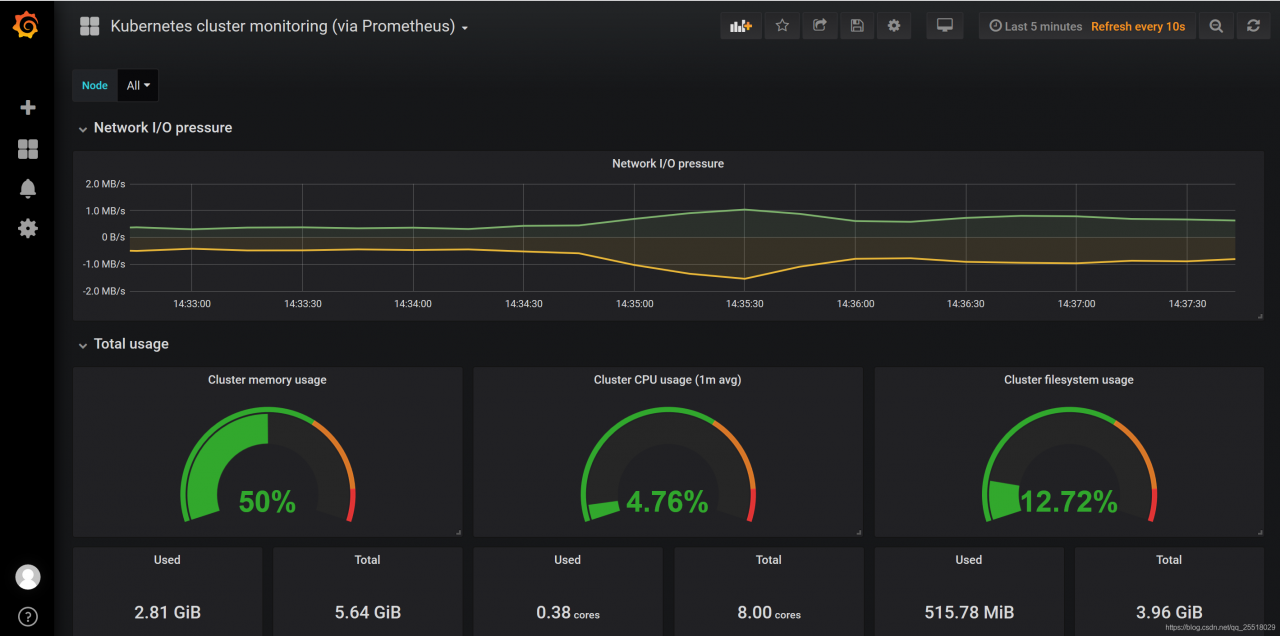
grafana提供了很多模板,类似和docker镜像仓库一下。导入模板也极其简单。点击上方的Dashboard
本文用到的模板:
容器监控模板:315 8588 3146 8685
主机监控模板:8919 9276 10467 10171 9965
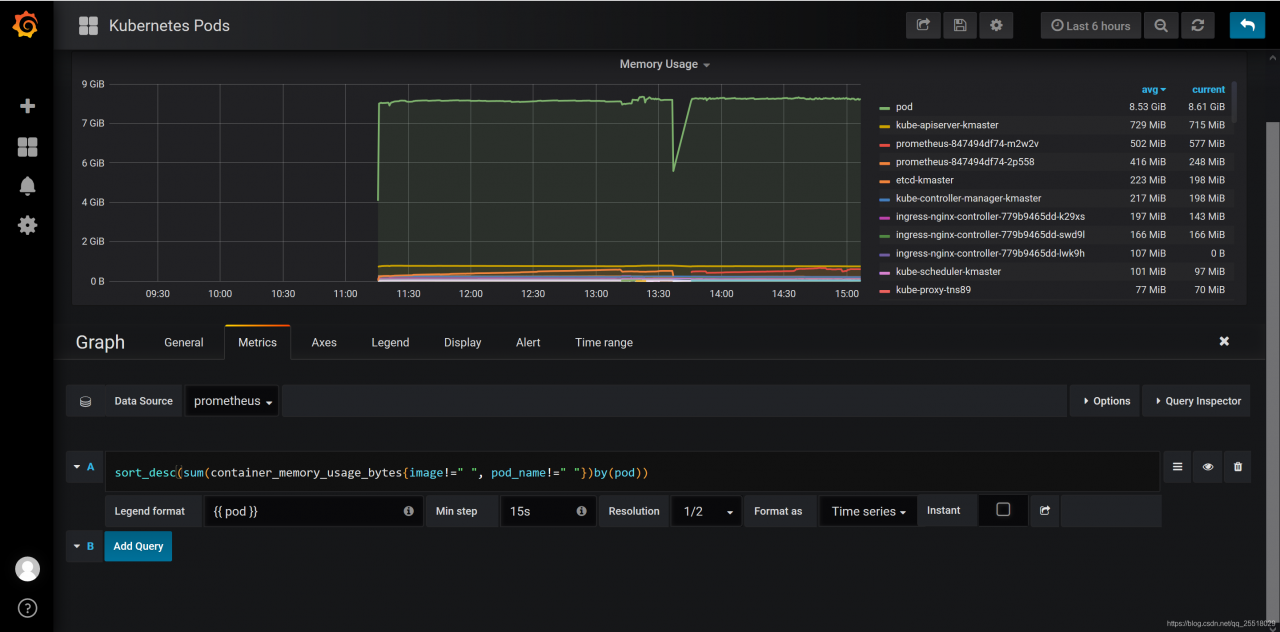
sort_desc(sum(container_memory_usage_bytes{image!=" ", pod_name!=" "})by(pod))
sum by(pod)(rate(container_cpu_usage_seconds_total{pod_name="$pod"}[1m]))