- 创建数据
test = scale(mtcars[,3:7])- 绘制热图
pheatmap(test)
- 修改颜色
pheatmap(test, color = colorRampPalette(c("#00AFBB", "#FC4E07", "#E7B800"))(50))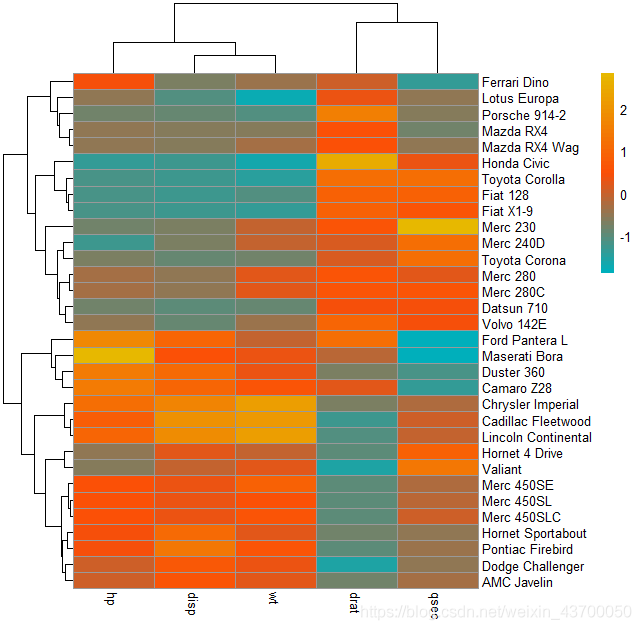
- 取消行列聚类
pheatmap(test, cluster_row = FALSE, cluster_cols = FALSE)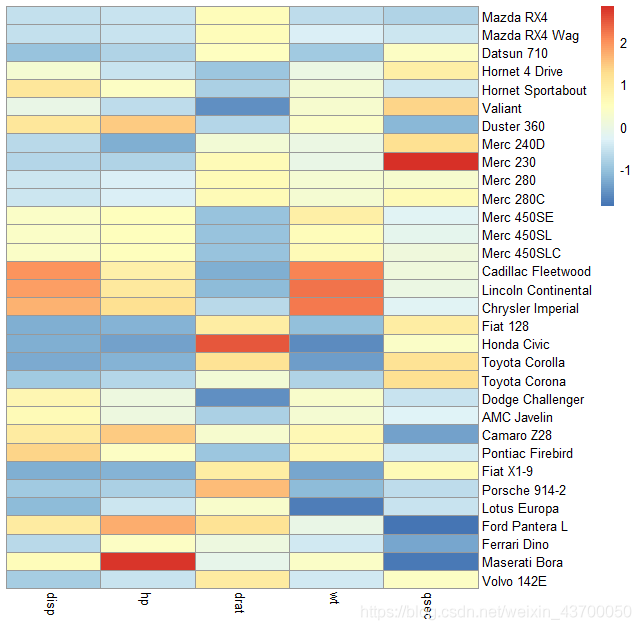
- 取消图例
pheatmap(test, legend = FALSE)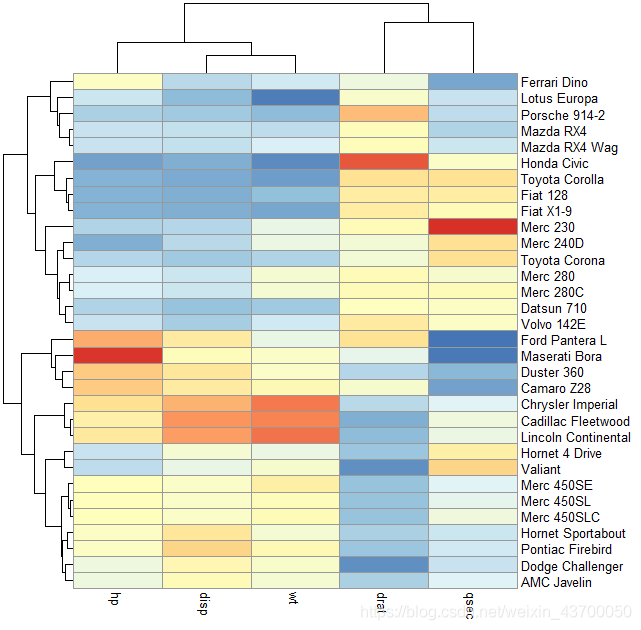
- 显示文本
pheatmap(test, display_numbers = TRUE)
data = matrix(ifelse(test > 0.5, "*", ""),nrow = nrow(test))
pheatmap(test, display_numbers = data)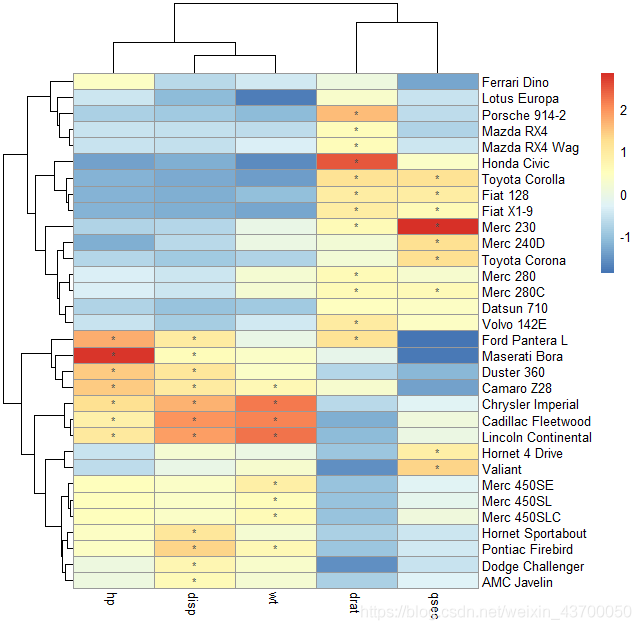
- 行列注释
annotation_col = data.frame(
  group_1 =  c('KK','KK','JJ','JJ','JJ'),
  group_2 = 1:5
)
rownames(annotation_col) = colnames(test)
annotation_row = data.frame(
  vs = factor(mtcars$vs)
)
rownames(annotation_row) = rownames(test)pheatmap(test, annotation_col = annotation_col, annotation_legend = FALSE)
pheatmap(test, annotation_col = annotation_col, annotation_row = annotation_row)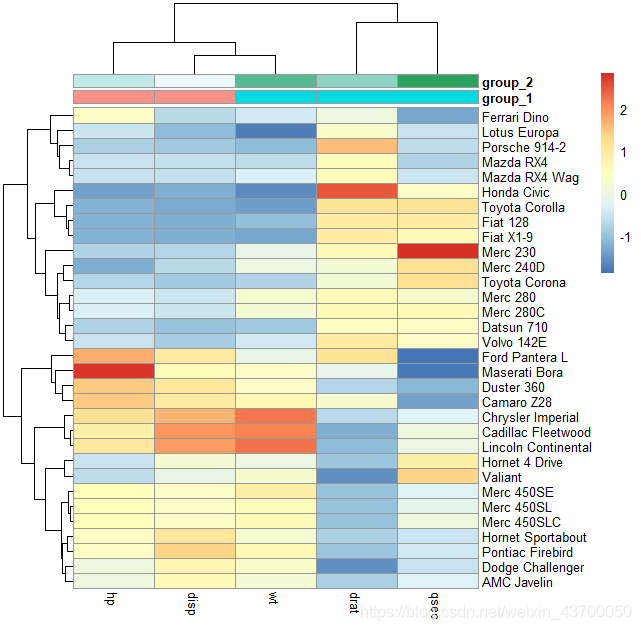

- 改变列名文本角度
pheatmap(test, annotation_col = annotation_col, annotation_row = annotation_row, angle_col = "45")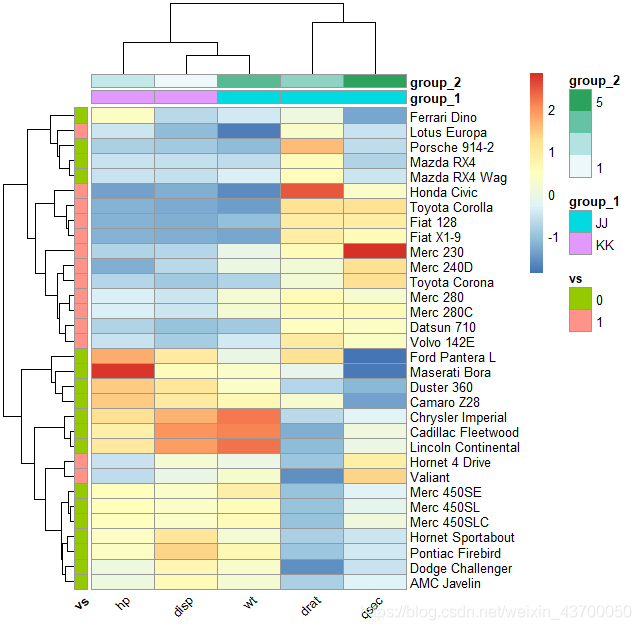
- Gaps in heatmaps
pheatmap(test,annotation_col = annotation_col,cluster_rows = FALSE,gaps_row = c(10, 14))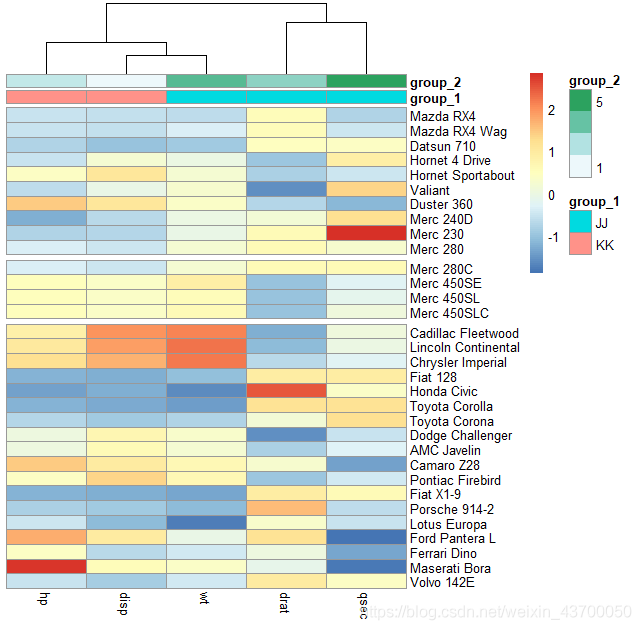
版权声明:本文为weixin_43700050原创文章,遵循CC 4.0 BY-SA版权协议,转载请附上原文出处链接和本声明。